

Resume: As compared to 2012, the GEL-denominated nominal GDP per capita increased by almost 56% in 2018 whilst the growth of the USD-denominated GDP per capita in 2018 is marginal and constitutes only USD 4 as compared to 2013. However, using USD calculated indicators whilst analyzing in time is speculative, because they are not free from the impact of changes in the currency exchange rate. The depreciation of the national currency exchange rate brings a number of negative consequences; although, whilst analysing the population’s income dynamic, there is no ground for converting these incomes to USD because GEL is the legal tender in Georgia and the population’s expenses are mostly denominated in GEL.
In order to analyse income dynamics, it is relevant to take the real GDP per capita[1] which is adjusted to changes in price levels (in turn, changes in price levels include the impact of changes in the currency exchange rate). In addition, it is appropriate to discuss the population’s real income dynamics in international dollars based on purchasing power parity (PPP) in order to make a comparison with other countries. This approach is in line with the spirit of Beka Liluashvili’s statement. The PPP approach envisions that currencies in different countries of the world have different purchasing power. This indicator is more relevant as compared to a simply USD-converted figure. However, the aim of converting into any universal unit, including the international dollar, is to compare the performance of different countries and in order to analyse a certain country’s GDP dynamics in time, it is the real GDP, denominated in the national currency, which is the universally accepted and relevant indicator.
In 2013-2018, both the real (25.6%) and PPP dollar GDP (real 25.6% and nominal 38.6%) were growing in Georgia. Therefore, we can conclude that in total, the GDP per capita in that period had a growth dynamic. Asserting that Georgia’s GDP decreased based on the nominal GDP figure denominated in USD is not correct.
Analysis
One of the founders of the public movement, Lelo, Badri Japaridze, stated: “Since 2013 until 2019, the GDP per capita has not increased. We are talking about a completely unacceptable and catastrophic trend that the GDP per capita, denominated in USD, has not increased in almost six years whilst, on the contrary, we need growth at huge rates in order to improve people’s situation, their opportunities and for them to escape from this impoverishment where the country is.” In response, the Economic Advisor to the Prime Minister, Beka Liluashvili, stated: “A method which was introduced by the International Monetary Fund and the World Bank is used to measure this indicator (the GDP in a universal unit). This is the international dollar indicator and it is that very method used in order to compare one country’s GDP per capita to the same indicator of another country instead of using a nominal currency of one specific country. Based on this indicator (PPP GDP), the GDP per capita in the country has increased by almost 40% as compared to 2012.”
The gross domestic product (GDP) reflects the value of the goods and services produced within the country for a certain period of time and which is a measurement of the size and the scale of a country’s economy. In turn, the GDP per capita is one of the indicators of the quality of life in a country. There is a variety of indicators to measure the value of the GDP (nominal GDP, real GDP, PPP GDP, etc). However, none of these aggregates has the universal ability to depict a trend. Table 1 shows each and every one of those indicators calculated for Georgia.
Table 1: Indicators of GDP Volume Measurement
|
№ |
Indicator |
2012 |
2018 |
Growth |
|
1 |
GDP Per Capita PPP (nominal, international dollars) |
8,240 |
11,421 |
38.6% |
|
2 |
GDP Per Capita PPP (real, international dollars) |
8,084 |
10,152 |
25.6% |
|
3 |
Real GDP Per Capita (GEL) |
6,343 |
7,965 |
25.6% |
|
4 |
Nominal GDP Per Capita (GEL) |
7,017 |
11,010 |
56.9% |
|
5 |
Nominal GDP Per Capita (USD) |
4,250 |
4,345 |
2.2% |
|
6 |
Real GD Per Capita (2010 USD) |
3,559 |
4,469 |
25.6% |
|
7 |
Real GDP Per Capita (USD-converted nominal exchange rate) |
3,842 |
3,144 |
-18.2% |
Source: World Bank, National Statistics Office of Georgia
The use of each indicator given in the table has its own boundaries and aims whilst the selection of an irrelevant unit for the analysis, either deliberately or as a result of incompetence, leads the author of the analysis to a flawed conclusion. For instance, the nominal GDP (4) is not free from the influence of inflationary processes and its use for analysis in time is absolutely unacceptable. The same applies to the USD-denominated nominal GDP (5) which, apart from inflation, also incorporates the impact of currency fluctuations and distorts the real trend.
The real GDP per capita, calculated in a national currency, is a widely accepted objective measurement to assess a certain country’s economic development trend. This measurement envisions the impact of inflationary processes and provides an objective understanding of a country’s economic growth. For a comparison with other countries, the independent indicator of PPP GDP is calculated (1, 2) which is somehow an artificial figure although it takes into account that the USD, which is often erroneously used as a universal measurement, has different purchasing power in different countries.
As illustrated by Graph 1, the GEL-denominated nominal GDP per capita increased by nearly 56% in 2018 as compared to 2012 whilst the growth of the USD-denominated GDP per capita is marginal and constitutes only USD 4 in 2018 as compared to 2013. However, none of these figures is acceptable for the analysis of a trend in time. The first one inflates the growth rate whilst the second shows the GDP to be substantially decreased against the backdrop of sharp depreciation of the currency exchange rate.
Graph 1: USD and GEL-Denominated Nominal GDP Per Capita in Georgia, 2012-2018
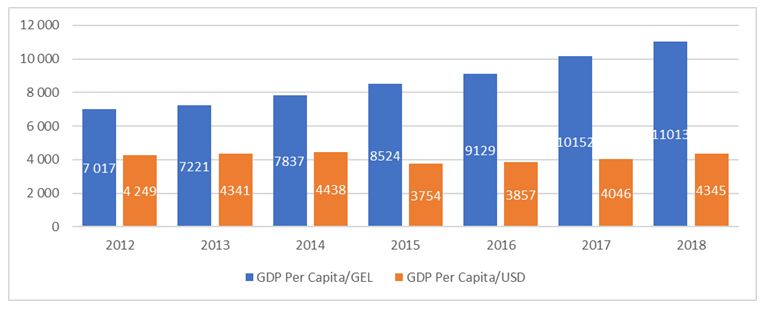
Source: National Statistics Office of Georgia
Of note is that quite frequently, whilst discussing the GDP dynamic, politicians name the USD-denominated nominal figure which is a wrong approach. Certainly, the depreciation of the national currency brings a number of negative consequences. This includes an increased debt service burden for those who have income in GEL and obligations in USD, more expensive import and travel abroad, etc. However, despite all of these, there is no ground for converting to USD whilst discussing the population’s income dynamic because GEL is the legal tender in Georgia and the population’s expenses are mostly denominated in GEL. The inflation rate incorporates the increase in price levels as a result of changes in the currency exchange rate. Therefore, in order to have a real figure, the nominal GDP should be adjusted not to USD but to the inflation rate.
Specific examples can be brought to emphasise the speculative nature of using the USD-converted GDP for analysis. For instance, we can take a look at Norway’s case where as a result of the depreciation of NOK vis-à-vis USD in 2015, the GDP per capita dropped by USD 22,000 and amounted to USD 74,000 whilst it was USD 97,000 in 2014. In fact, the real volume of Norway’s economy has not decreased and we are misled by taking this incorrect figure. There were cases of similar decreases in a number of countries because the USD exchange rate appreciated worldwide in the second half of 2014.
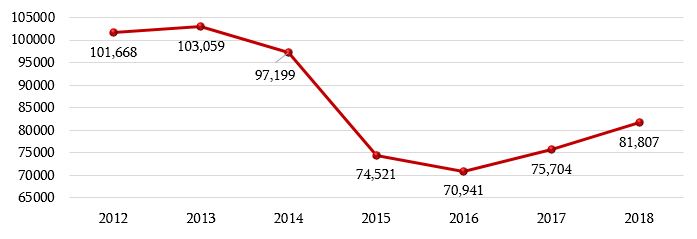
Source: World Bank
In order to avoid the aforementioned mistakes, it is relevant to take the real[1] GDP per capita when discussing income dynamics which is adjusted to changes in price levels (in turn, changes in price levels incorporate the impact of changes in a currency exchange rate). In addition, as mentioned by Mr Liluashvili, it is possible to discuss a population’s income dynamics in international dollars based on purchasing power parity (PPP) in order to make a comparison with other countries. The PPP approach envisions that currencies in different countries of the world have different purchasing power. Production prices are lower whilst a currency’s purchasing power is higher in low-income countries (it is possible to purchase more product with USD 1).
Graph 3: Real GDP (Per Capita) and GDP PPP Dynamics in 2013-2018, Georgia
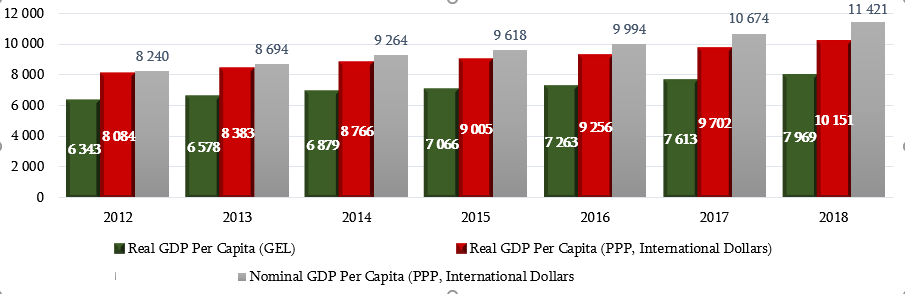
Source: National Statistics Office of Georgia
As illustrated by Graph 3, both the real GDP and the GDP denominated in PPP dollars were growing in 2013-2018. Therefore, we can conclude that the total GDP per capita shows a growth dynamics and the claim that Georgia’s GDP has decreased based on the USD-denominated nominal GDP figure is far from reality.
[1]Inflation; that is, the price increase effect is excluded in real indicators.