
In January-May 2023, export increased by 18.6% from USD 2.110 billion to 2.503 billion as compared to the same period of the previous year. However, local export (export without re-export), on the contrary, decreased by 22.9% from USD 1.598 billion to USD 1.232 billion. As a result, the value of re-export which largely increased at the expense of cars by 148% from USD 513 million to USD 1.270 billion exceeded the value of net export.
Export consists of two parts – local export and re-export. Re-export also creates added value and its growth, taken separately, is a positive occurrence. However, for the economic development – be it job creation or introduction of new technologies in some cases, local export is more important.
In terms of export destinations, local export value dropped most significantly to China – largely at the expense of copper ores – from USD 344 million to USD 176 million which equals a 48.8% contraction. There was a significant decrease of local export destined to Turkey, Bulgaria, Peru, Switzerland and Ukraine.
Georgia’s local export to the EU member states decreased by 6.6% from USD 305 million to USD 285 million whilst local export to the USA collapsed by 87% from USD 138 million to USD 17.7 million. In this light, the 6.9% growth of local export to the CIS countries from USD 396 million to USD 423 million was insufficient to have a total local export growth.
Graph 1: Local Export by Countries (USD Million)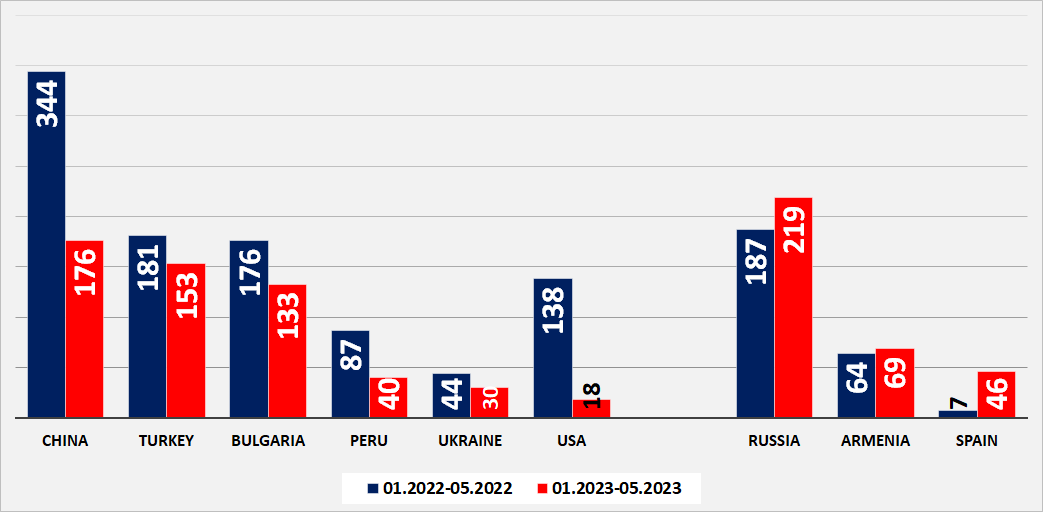
Source: National Statistics Office of Georgia
In total export (including re-export), Russia is ranked third with an 11.2% share after Armenia and Azerbaijan. In 2022, Russia also held the third position with 10% and was only outperformed by China and Azerbaijan.
Dependence on Russia is much higher in terms of local export. In January-May 2022, Russia’s share in Georgia’s net export was 11.7% and it was the second biggest export destination after China. In January-May 2023, its share increased to 17.8% which put Russia in the first position. In turn, China’s share declined from 21.5% to 14.3%.
The decrease in local export was largely caused by the dwindling demand on minerals. Export of copper ores shrank from USD 466 million to USD 311 million and export of ferro-alloys decreased even more from USD 280 million to USD 86 million. Of note is that the export of nitrogen fertilisers dropped from USD 153 million to USD 86 million. On the contrary, the export of wine, spirits and mineral waters increased.
Graph 2: Local Export by Product Items (USD Million)
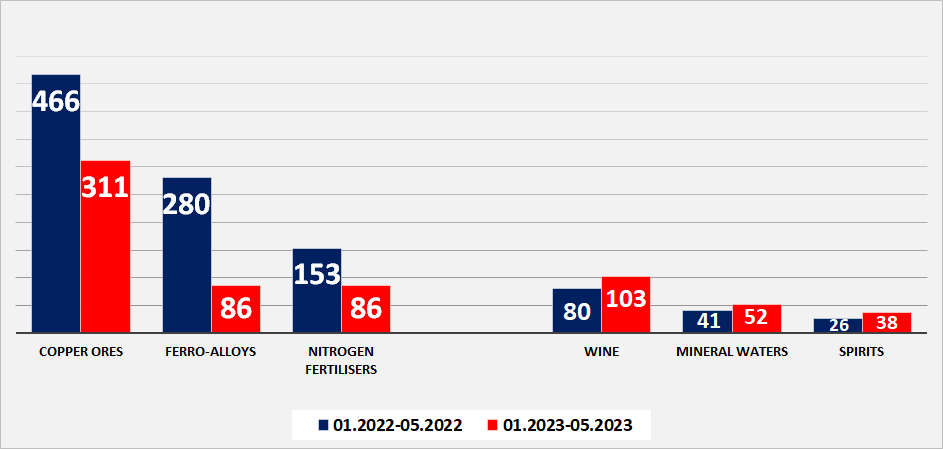
Source: National Statistics Office of Georgia
The growth of total export is largely attributable to the re-export of cars. In January-May, the export of vehicles increased by USD 604 million from USD 191 million to USD 795 million. The share of cars in total export was 9.1% in January-May 2022 (that is, less than one-tenth) and it grew to 31.8% in the first five months of 2023 which is an increase to almost one- third.
Total re-export in January-May 2022 was USD 513 million whilst it was 148% more – USD 1.270 billion in the same period of 2022.
The National Statistics Office of Georgia has been publishing separate information about local export since 2014. In that period (in January-May each year), the share of local export was within the margin of 61%-78%. In January-May 2022, this figure stood at 75.7%. In the first months of 2023, however, it dropped to 49.2% which is the lowest figure in the entire reporting period.
Graph 3: Local Export to Total Export Ratio, January-May
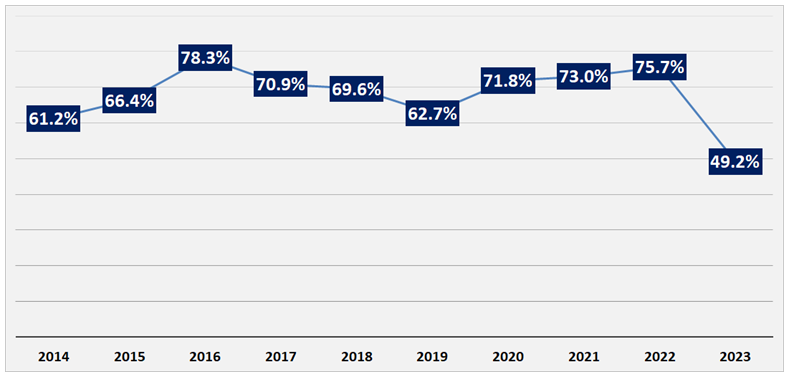
Source: National Statistics Office of Georgia
The trend is even more discernible when analysing separately by months. In January, the share of local exports was 78% and in May it was 47%. As compared to the same period of the previous year, local export increased by 12% from USD 232 million to USD 259 million in January alone. This was followed by a 26% decline in February with the rate of decline reaching 37% in May. In May of the previous year, the volume of local export amounted to USD 390 million whilst in May 2023 it was USD 246 million.
The decrease in the share of local export was caused by two factors simultaneously – a decline in the volume of local export and an increase in re-export. The increase in re-export is almost entirely due to auto exports while the decline in local exports is mainly distributed over three products: copper ores, ferro-alloys and nitrogen fertilisers. In January-May of the previous year, the income received from the export of these three products amounted to USD 899 million whilst in the same period of 2023 it was USD 416 million less - USD 483 million. Export of other products increased by only USD 50 million which was insufficient to cover the decrease in the share of the main export items. Local export decreased overall by USD 366 million in the first five months of 2023.
The prices of both copper ores and ferro-alloys have plunged on the global market. The value of the export of copper ores decreased by 33% and by 13% in terms of tonnage; that is, the export price has dropped. More specifically, the export price of one tonne of copper ore averaged USD 8,688 in January-May 2022 and it decreased by 22% to USD 6,777 in the same period of 2023.
The situation is even more serious in the direction of ferro-alloys as value of its export has decreased by 70% and by 46% in terms of tonnage. The average export price of ferro-alloys decreased by 43% from USD 2,163 dollars to USD 1,223 per tonne. Since 23 January 2023, Russia imposed a 21.5%-24.5% tax on the import of Georgian ferro-alloys due to the fight against dumping prices which had a negative impact on export to this country. Export was basically suspended and production has been virtually halted Whilst small businesses in this sphere were closed. Employees of Georgian Manganese went on strike demanding the improvement of working conditions and a salary increase. In April, only USD 2.6 million worth of ferro-alloys were exported. In May, this amount was USD 2.1 million.
The average export price of nitrogen fertilisers decreased by 23% from USD 672 to USD 516 per tonne which cased its export to decrease by 27% in terms of tonnage and 44% in terms of value.
As with oil, there are no fixed prices for any other raw material. Changes in demand and supply make its price rise or fall. Generally, growth is followed by decline and decline is followed by growth but it is impossible to accurately determine price decreases or increases in advance as well as when a turning point will come.
Reduced local export, despite increased re-export, means a decline in economic activity. Given the scale, Georgia does not have any leverage on pricing. The very fact that the share of the export of raw materials in local export is high is a separate problem. A much higher added value is generated by the production of final products, although Georgia produces final products that are only intended for export and in a very limited amount with the exception of wine, alcoholic beverages and mineral waters.