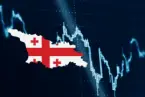

Irakli Kobakhidze: “In 2022, EU member states increased import from Russia more than Georgia did. The EU has an animated trade with Russia.”
Verdict: FactCheck concludes that Irakli Kobakhidze’s statement is FALSE.
Resume:
According to Irakli Kobakhidze’s statement, EU member states increased import from Russia more than Georgia. In order to corroborate his statement, Mr Kobakhidze provides figures of certain countries and claims that Georgia only has an “insignificant growth” as opposed to them. In fact, those percentage changes named by Irakli Kobakhidze do not in the main match with the data provided by statistical agencies of relevant countries. In addition, in the first 11 months of 2022, Georgia’s import from Russia increased by 73% which cannot be dismissed as an “insignificant growth,” especially given the fact that import from the EU increased by only 34% in the same period. The trends also contradict the spirit of his statement because EU countries cut import volume from Russia by 18% in September-November 2021 as compared to the same period of 2021 whilst Georgia continued to have a sharp growth of import from Russia throughout the entire year.
Off additional importance is that Irakli Kobakhidze shifted focus entirely on import, although “trade” also includes export. In the first 11 months of last year, Georgia’s export to Russia increased by 8.9% whilst the EU’s export experienced a significant contraction. In January-November 2022, the EU-Russia total trade turnover increased by 9% whilst the Georgia-Russia trade turnover increased by 49%. Therefore, Irakli Kobakhidze’s statement in regard to both import and total trade figures is FALSE.
Analysis
On 19 January 2023, chairman of the Georgian Dream, Irakli Kobakhidze, on air on TV Imedi’s Imedi LIVE broadcast, stated the following whilst speaking about trade relations between the Russia and EU member states: “If we take the EU member states, only seven countries have reduced their foreign trade with Russia. I will now tell you import figures – except for those seven countries, import from Russia increased everywhere and the growth figures are considerable. Can you imagine that Germany’s imports from Russia increased by 33% as compared to imports in 2021? Poland’s import increased by 24%, Italy’s import has doubled to a 100% growth, France’s import increased by 84%, the Netherlands by 51%, Belgium by 78%, Greece by 142%, Spain by 51% and I will not keep listing them.” In response to the TV show host’s question about what was happening in Georgia in this regard, Mr Kobakhidze stated: “In regard to import, there is a slight growth. It is much less as compared to those of EU member states. It is a slight growth and in the history textbooks, we had the term animated trade. EU member states have animated trade with Russia.”
The figures provided by the Georgian Dream chairman in most cases are not accurate. More specifically, the value of import from Russia to Germany was EUR 29.8 billion in January to November 2021 whilst it increased by 13% to EUR 33.7 billion in the same period of 2022. On the contrary, Germany’s export to Russia decreased by EUR 24.6 billion to EUR 13.8 billion which is a 44% decrease. If we calculate these data in USD, there will be a 2% growth of import and a 50% decline in export.
The picture gets even more interesting if we divide the first 11 months of last year into periods and take the last three months; that is, September-November, to identify a trend. In September-November 2021, the value of Germany’s export to Russia was EUR 7.3 billion whilst it was 55% less at EUR 3.3 billion in the same period of 2022. In regard to import, it dropped by 45% from EUR 9.3 billion to EUR 5.1 billion. Statistics of the last months illustrate that Germany does not have an increased trade turnover with Russia but rather, a decrease.
Italy’s figure indeed increased sharply - by 62.6% - vis-à-vis import from Russia in January-November 2022. However, this figure is still far from Irakli Kobakhidze’s claim that the growth figure sits at 100%. In addition, despite such a sharp growth, import from Russia decreased by 39.5% in November 2022. If look at a wider picture, export from Italy to Russia decreased by 23.4% in the first 11 months of last year and, particularly, by 27.6% in November 2022.
France’s statistics are relatively closer to the 84% growth as claimed by Irakli Kobakhidze. Specifically, France increased its import from Russia by 67% from EUR 8.8 billion to EUR 14.6 billion in January-November 2022 as compared to the same period of 2021.
In the first nine months of 2022 (Belgium’s statistical service’s website offers only January-September data), Belgium increased its import from Russia by 95% from EUR 5.4 billion to EUR 10.5 billion. In this case, the growth rate even exceeds the figure named by Irakli Kobakhidze.
Of the aforementioned EU member states, Greece increased import from Russia the most by 125% from EUR 3.8 billion to EUR 8.5 billion. Despite the impressive growth, this figure is still less as compared to the 142% claimed by Irakli Kobakhidze.
Spain also increased its import from Russia in January-November, although not by 51% as Mr Kobakhidze claimed but by 32% to EUR 7 billion. In November 2022, Spain also had a slight 0.3% drop in import from Russia.
In January-November 2022, Poland purchased produce from Russia valued at EUR 15 billion (USD 16.2 billion). In 2021, the total value of Poland’s import from Russia was EUR 17 billion. There are no December 2021 data available separately, although Poland’s statistics service’s website offers additional information. In November-December 2021, Russia’s share in Poland’s import was 5.7% and 4.5% in the same period of 2022. In order to have a 24% growth of import from Russia, annual import from Russia should have increased to EUR 21 billion. In other words, when the average value of import in January-November 2022 was EUR 1.250 billion, it should have increased massively up to EUR 6 billion.
There is an interesting picture when it comes to the EU as a whole. All 27 EU member states purchased EUR 145 billion in products from Russia in January-November 2021 whilst it increased by 34% to EUR 194 billion in the same period of 2022. However, the trend should be taken into consideration in this case as well. If we compare September-November figures, there would be a 18% decline instead of growth. More specific dynamics are shown in the graph.
Graph 1: Import from Russia to the EU
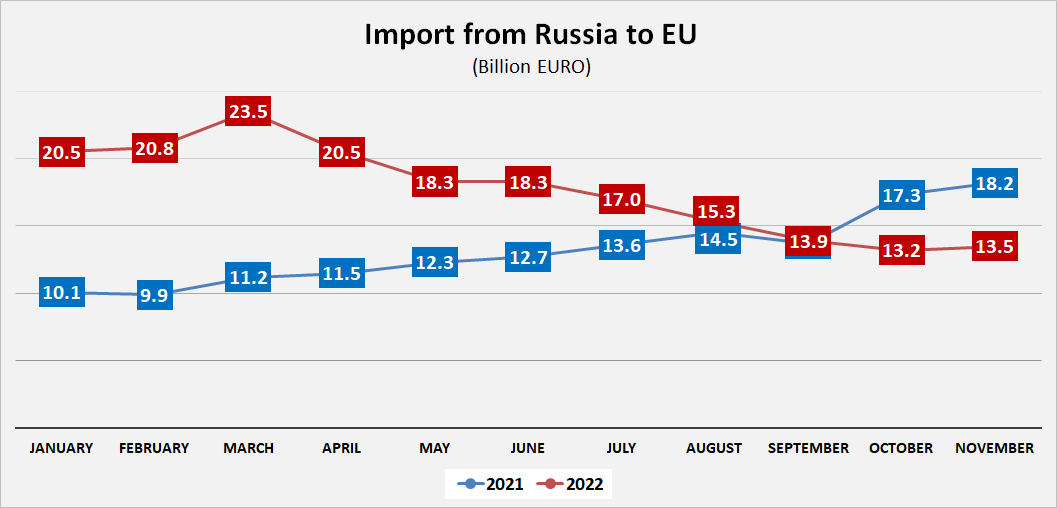
Source: Statistical Service of the European Union (Eurostat)
As early as prior to the outbreak of Russia’s war against Ukraine, import from Russia already increased by 104% in January 2022. There was a 110% growth rate in February followed by a 109% growth rate in March. The change in this trend became visible from April when the growth rate decreased to 78%. In September 2022, the EU decreased import from Russia even as compared to September 2021. There was only a 1% decrease which widened to 24% in October and to 26% in November. Increased import at the beginning of the year is attributable to higher oil and gas prices. Oil and gas were already significantly more expensive prior to Russia’s invasion of Ukraine.
In case of Georgia, the dynamics are different and growth is visible throughout the entire 2022. The only exception is March when import was only 3% higher as compared to the same period of the previous year. In April, the growth rate reached 34% and 98% in May 2022. The record high 116% rise in import was in August.
In total, Georgia increased import from Russia by 73% from EUR 930 million to USD 1.609 billion in January-November 2022 as compared to the same period of the previous year. Since Irakli Kobakhidze was speaking about the first 11 months of 2022, the graph does not include the month of December. At the time of the interview, December’s figures were not yet available. In December, taken separately, the import growth rate accelerated further and reached 140%
Graph 2: Import from Russia to Georgia
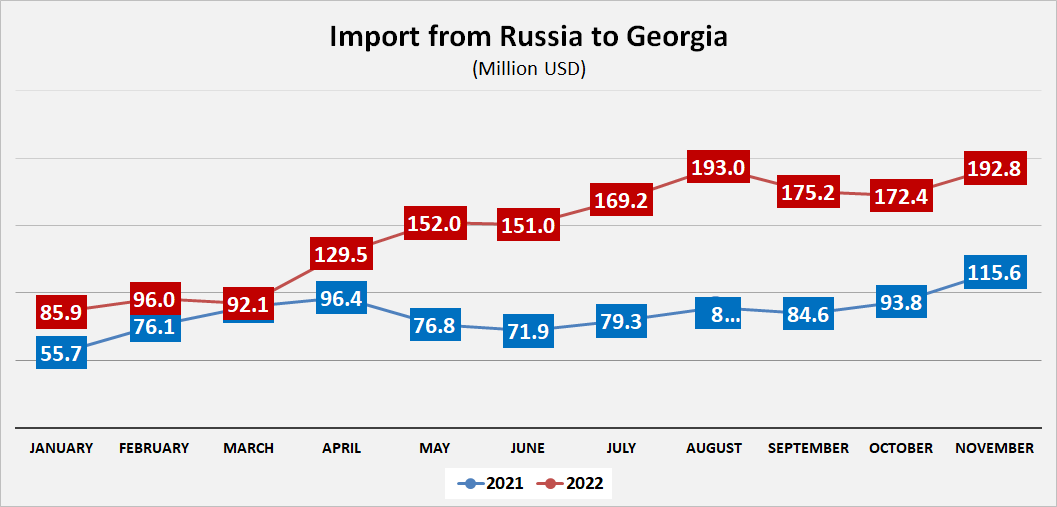
Source: National Statistics Office of Georgia
Of note is that in the first 11 months of 2022, import increased largely at the expense of the price of fuels. Both volume and import prices increased. In January-November 2022, import of fuel from Russia increased by 353% from USD 124 million to USD 562 million and the volume increased by 182% from 207,000 to 583,000 tonnes.
Irakli Kobakhidze made emphasis on the import component; however, he also mentioned the term “animated trade.” Apart from import, trade also includes export. Of note is that Georgia would also not have an advantageous situation when it comes to export. In the first 11 months of last year, Georgia’s export to Russia increased by 8.9% from USD 549 million to USD 598 million. In the same period, the total export of all EU 27-member states to Russia decreased by 36.7% from EUR 81.4 billion to EUR 51.6 billion. In January-November 2022, the EU-Russia total trade turnover increased by 8.5% from EUR 226 billion to EUR 246 billion as compared to January-November 2021 whilst the Russia-Georgia trade turnover increased by 49.3% from USD 1.478 billion to USD 2.206 billion.
Graph 3: Change of Trade Relations with Russia

Source: National Statistics Office of Georgia and Statistical Service of the European Union (Eurostat)
An analysis of the first 11 months of 2022 illustrates that Georgia’s import from Russia increased twice as much (by 73%) as compared to that of the EU. At the same time, import growth changed into an import decrease for the EU from September 2022 whilst Georgia kept its pace unchanged. In the same period, Georgia’s export to Russia increased by 8.9% whilst export of the EU member states to Russia decreased by 36.7%. In total, the EU’s trade turnover with Russia increased by 9% in the first 11 months of 2022 whilst Georgia’s trade turnover with Russia increased by 49%. Therefore, Irakli Kobakhidze’s statement is FALSE.