
Resume:
Soso Archvadze, a Georgian economist, made a Facebook publication to claim that even today all three Baltic states have much closer economic (trade) relations with the Russian Federation as compared to Georgia. In order to corroborate his claim Mr Archvadze provided export and import per capita statistics. According to the information verified by the FactCheck, although in terms of monetary value, Baltic states do indeed have more trade with Russia (as well as with the rest of the world) as compared to Georgia, share of their trade with Russia measured both in per capita and per country is much lower than in case of Georgia. Therefore, claim that Baltic countries have closer than Georgia trade relations with Russia is FALSE.
Analysis
On 3 January 2023, Soso Archvadze, a Georgian economist, made Facebook publication and claimed that even today, all three Baltic states have much closer trade (economic) relations with the Russian Federation as compared to Georgia. As an argument, Mr Archvadze provided statistics that total trade turnover of Estonia, Lithuania and Latvia with Russia was higher to Georgia’s trade turnover with Russia both when measured in absolute numbers and in per capita.
Total value of the Baltic states’ trade turnover with Russia per capita exceeds that of Georgia’s. However, since these countries also trade more with the rest of the world as well, Russia’s share in their trade is merely 6% whilst for Georgia it is 2.17 times more – 13%. Therefore, claim that Baltic countries have closer trade relations with Russia as compared to Georgia’s trade relations with Russia, is not true. In addition, the so-called screenshots, included in Mr Archvadze’s publication as some kind of evidence, are simply shipment documents (CMR) and have nothing to do with the statistical data.
FactCheck reached out to the author of the publication, Soso Archvadze, via phone and asked to provide those links where he accessed the aforementioned information. As stated by Mr Archvadze, he had a limited time when he found the informationand did not save the links. In response to FactCheck’s question on specific figures (after verification it was found out that similar to per capita indicators, absolute numbers were also wrong and some of his figures significantly deviate from real data) Mr Archvadze stated that most important for him was to highlight difference in terms of export/import per capita.
FactCheck will not go into discussion whether it is more relevant to use total export/import/trade turnover for general analysis or to use calculations per capita. In each separate case, choice depends on purpose of analysis. When it comes to analysing dependency/closeness to one specific market (both in absolute numbers and per capita) share of that market is much important element instead of absolute figures (either total turnover or measured per capita). Therefore, although ratios would have been similar when measuring Russia’s share both for a country in total and per capita (for instance, if Russia’s share for Estonia is hypothetically X percent, it will still be X percent when measured in per capita), since the author of the publication underlines per capita figure, FactCheck will also use that indicator for analysis.
Methodologically, per capita export and import figures are rarely used and therefore statistics of this indicator are seldom processed and published timely/in advance. However, per capita export and import measurement is possible with simple calculation – by dividing absolute figures to the number of population.
As reported by the Statistics Estonia, country’s export in the first 11 months of 2022 reached EUR 17.8 billion whilst export to Russia amounted EUR 663 million. In the same period, total import was EUR 19.8 billion, including EUR 1.740 billion from Russia. Per capita export to the whole world amounted to EUR 13,577 and EUR 506 to Russia specifically whilst per capita import from the entire world amounted to EUR 15,103 and EUR 1,327 from Russia. Per capita trade turnover with the entire world amounted to EUR 28,680 and EUR 1,833 with Russia.
Estonia’s dependence on Russia both as a country and per capita is as follows: 3.7% in export, 8.8% in import and 6.4% in total trade turnover.
Lithuania’s export in January-November 2022 reached EUR 40.376 billion. Of that amount, exports to Russia were valued at EUR 2.472 billion. In 11 months, Lithuania’s imports accounted for EUR 47.822 billion, including EUR 2.540 billion from Russia. Per capita export to the world amounted EUR 15,370 and EUR 941 to Russia. Per capita import from the entire world amounted to EUR 18,204 and EUR 967 from Russia. Per capita trade turnover with the entire world and Russia separately were EUR 33,574 and EUR 1,908, respectively.
Lithuania’s dependence on Russia both as a country and per capita is as follows: 6.1% in export, 5.3% in import and 5.7% in total trade turnover.
In the same period, of Latvia’s EUR 19.429 billion total export, Russia accounted for EUR 1.085 billion whilst total import amounted to EUR 24.113 billion, including EUR 1.630 billion from Russia. Per capita export to the entire world was EUR 10,302 and EUR 575 to Russia. Per capita import from the entire world was EUR 12,785 and EUR 864 from Russia whilst total trade turnover per capita with the entire world and Russia were EUR 23,087 and EUR 1,440, respectively.
Latvia’s dependence on Russia both as a country and per capita is as follows: 5.6% in export, 6.8% in import and 6.2% in total trade turnover.
In regard to aggregated data of all three countries, total export of Lithuania, Latvia and Estonia in January-November 2022 amounted to EUR 77.605 billion, including EUR 4.220 billion to Russia. Total import reached EUR 88.189 billion and Russia’s share was EUR 5.910 billion. Total trade turnover constituted EUR 169 billion and Russia accounted for EUR 10.130 billion of that amount. Average export per capita amounted EUR 13,325 to the entire world and EUR 725 to Russia. Average import per capita from the entire world amounted EUR 15,751 and EUR 1,015 from Russia whilst total per capita trade turnover with the entire world reached EUR 29,076 and with Russia EUR 1,739.
For each country, average share of trade with Russia both as a country in total and measured in per capita is as follows: 5.4% in export, 6.8% in import and 6.0% in total trade turnover.
In January-November 2022, Georgia exported USD 4.546 billion value products in total and goods valued at USD 598 million were exported to Russia. In the same period, import reached USD 11.981 billion and Russia’s share in total import was USD 1.608 billion. Georgia’s total trade turnover was USD 17.018 billion and Russia accounted for USD 2.206 billion. In case of Georgia, per capita export to the entire world is USD 1,229 whilst in case of Russia separately it is USD 143. Georgia’s total import per capita is USD 2,887 and Russia’s share is USD 383. When it comes to Georgia’s total trade turnover per capita vis-à-vis the world and Russia it is USD 4,116 and USD 526, respectively.
If we calculate Russia’s share in Georgia’s total trade as of January-November 2022, it will be 11.9% in export, 13.4% in import and 13.0% in total trade turnover both for the whole country and measured in per capita.
This graph shows Baltic states’ and Georgia’s trade and economic dependence on Russia both as a country and per capita
Graph 1: Georgia’s and Baltic States’ Trade and Economic Dependence on Russia
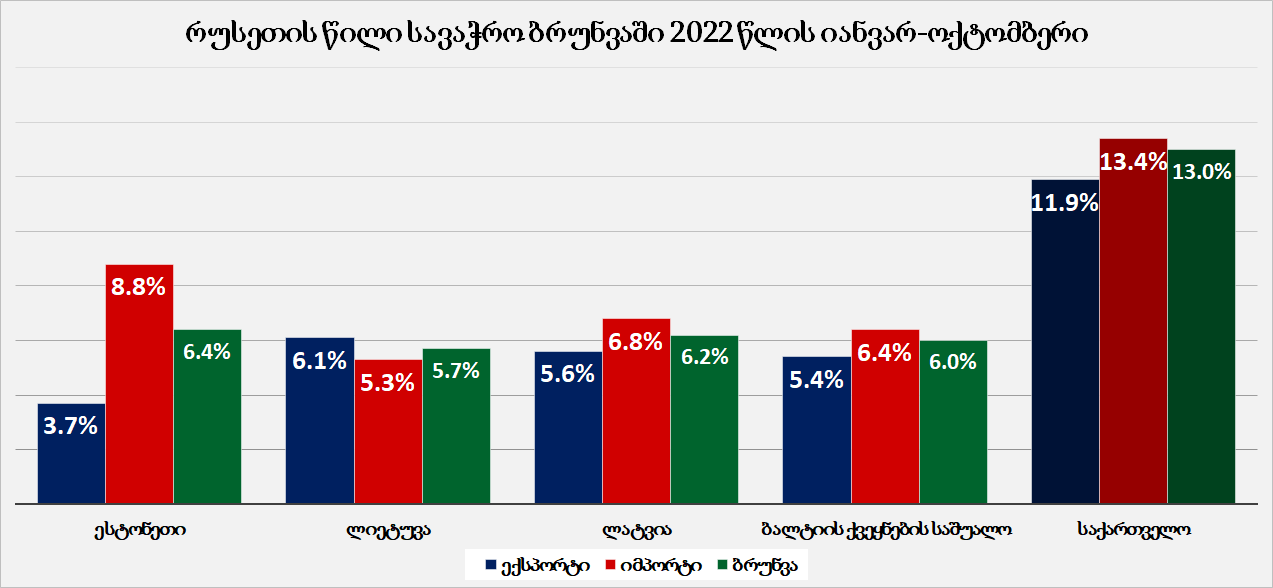
Source: Statistical Authorities of Georgia, Estonia, Lithuania and Latvia
Baltic states compile their statistics in EUR whilst Georgia compiles in USD. However, this difference had no effect when calculating the share. Hypothetically speaking, EUR 8 is the same in proportion to EUR 100 as USD 8 is in proportion of USD 100.
Of note is that in 2022 Georgia deepened trade relations with Russia. In January-November 2021, trade with Russia accounted to 11.5% of Georgia’s total trade. In addition, export dependency decreased from 14.4% to 11.9% but import dependency increased from 10.3% to 13.4% in the same period. In terms of monetary value, import increased by USD 679 million from USD 929 million to USD 1.608 billion which constitutes 73.1% growth. The import of petroleum products increased the most from USD 124 million to USD 562 million (353% growth) and this happened not only because of rising prices on fuel. Volume of Russian-imported fuel increased by 182% from 206,000 tonnes to 583,000 tonnes.
Both in case of export and import and therefore, in total trade turnover as well, Georgia’s dependence on Russia (measured in per capita and as a whole), is higher as compared to Estonia, Lithuania and Latvia irrespective when compared to each of them separately or average figure of all three Baltic stated. None of the Baltic states, neither in export nor in import and therefore nor in total trade turnover is more dependent on Russia than Georgia.
In absolute figures, trade turnover of the Baltic states with Russia is indeed higher as compared to Georgia’s trade turnover with Russia, including per capita indicator. However, the Baltic states are richer than Georgia, they produce and consume more goods than Georgia. Although Estonia’s population is three times less (1.331 million) as compared to Georgia’s population, its export in the first 11 months of 2022 amounted to EUR 17.8 billion which is four times higher as compared to Georgia’s export. Therefore, trade turnover of the Baltic countries, when compared to that of Georgia’s, is higher when it comes to Russia as well as with the rest of the world.
If the Baltic states’ trade turnover with Russia per capita is 3.3 times higher as compared to Georgia’s per capita trade turnover with Russia, Baltic states have 7.1 times bigger per capita trade turnover with the rest of the world as compared to Georgia (with EUR-USD average exchange rate at 1.05).
Although Baltic states’ trade turnover with Russia is higher as compared to Georgia’s trade turnover with Russia both in terms of per capita measurement and as a whole, since their export and import with the rest of the world are even higher Russia’s share in trade for the Baltic states is 6% whilst for Georgia it is 13%. Therefore, claim that Baltic states’ trade dependence on Russia is higher as compared to Georgia’s, is not true.
-----------------------------------------------------------------------------
This article was produced as part of Facebook’s Fact-checking Programme. Given the rating, Facebook may impose different restrictions – click here for full information. For information on issuing a correction or to dispute a rating, please see here.