

Resume: Money’s purchasing power declines over time. Consumer price inflation is measured by the Consumer Price Index which includes prices on food and non-alcoholic beverages. A price increase is higher in some groups and lesser in the others whilst the final figure is an average (weighted) number. Therefore, it is possible to have a lower general inflation figure whilst the inflation rate could be higher in those groups which are more sensitive for the general populace.
The prices for food and non-alcoholic beverages are 45.5% more in June 2020 as compared to June 2012 whilst the price increase was 49.7% if we compare May 2020 and May 2012. As of January 2020’s data, the price growth for food and non-alcoholic beverages constituted 36% as compared to the same period of 2012. The inflation rate in this group significantly exceeds the general inflation rate (for instance, by 5.3 percentage points in 2019) which painfully affects the population, especially its poorer part. In this part of Giorgi Vashadze’s statement, the context is relevant. The inflation figure (54%) named by Mr Vashadze is not found for any period vis-à-vis food and non-alcoholic beverages, although the figure in the statement is very close to the actual one.
Analysis
The leader of the political platform Strategy Builder, Giorgi Vashadze, stated: “In eight years food became 54% more expensive in the country.”
As a result of inflation, money’s purchasing power declines over time and less goods and services can be purchased with GEL now as compared to previously. Consumer price inflation is measured by the Consumer Price Index which includes prices in 12 large groups of goods. These groups are as follows: 1) food and non-alcoholic beverages, 2) alcoholic beverages and tobacco, 3) garments and footwear, 4) accommodation, water, energy, gas, 5) furniture, household items, house repair, 6) healthcare, 7) transport, 8) communication, 9) vacation, leisure and culture, 10) education, 11) hotels, cafes and restaurant and 12) different goods and services.
The price increase is higher in some groups and lesser in others whilst the final figure is an averaged number. Therefore, it is possible to have a lower general inflation figure whilst the inflation rate could be higher in those groups which are more sensitive for the general populace such as, for instance, food and non-alcoholic beverages, utilities and healthcare.
Of note is that inflation in general; that is, a price level increase, is a natural process and quite frequently goes hand in hand with economic growth. It is important that economic growth and the growth of other incomes exceed the inflation growth which eventually would lead us to real growth. Since 2009, the National Bank of Georgia’s monetary policy has been inflation targeting. The policy envisions a prior determination of the target inflation rate which has to be kept in a mid-term period. The National Bank of Georgia sets the target inflation figure which is later approved by the Parliament of Georgia. Therefore, in order to assess inflationary processes, it is important to analyse how inflation was kept within the targeted margins. Naming a total figure of increased prices, taking several years together, might provide a dramatic impression although it is necessary to consider the annual dynamic for an analysis of the real situation.
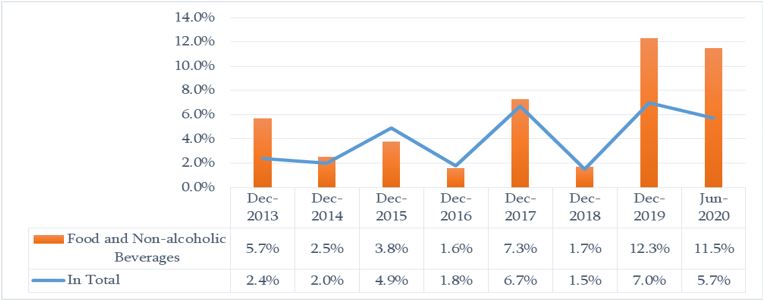
Table 1 illustrates the general annual (the inflation rate of a year’s certain month vis-à-vis the same month of the previous year) inflation as well as inflation for food and non-alcoholic beverages. With the exception of 2015 and 2016, inflation for this particular group is higher as compared to the general inflation rate. The gap was particularly striking in 2019 when inflation for food and non-alcoholic beverages (12.3%) was 4.7 percentage points more as compared to the general inflation rate (7%).
Table 1: Rates of General Inflation and Inflation in the Group of Food and Non-alcoholic Beverages in 2013-2020 (%)
Prices for food and non-alcoholic beverages are 45.5% more in June 2020 as compared to June 2012 whilst the price increase was 49.7% if we compare May 2020 and May 2012. As of January 2020’s data, the annual inflation for food and non-alcoholic beverages constituted 36%. Of final note is that the inflation rate in this group significantly exceeds the general inflation rate which painfully affects the population, especially its poorer part.