

Resume: As stated by Natia Turnava, the growth of foreign direct investments (FDI) constituted 13.6% in the third quarter of 2019 as compared to the same period of the previous year with the reinvestment figure having doubled from USD 125 million to USD 258 million.
The figures for 2019 are not fully available at this point and so it is technically possible to calculate and compare the average figures for 2013-2018 and 2006-2012. In 2006-2012, the average annual volume of FDI was USD 1.17 billion and in 2013-2018 it was USD 1.58 billion which constitutes a 34.5% growth. This growth does correspond to the figure named by Ms Turnava. However, a comparison of the absolute figures for FDI from different years is speculative and cannot be used as an indicator of a successful dynamic since the economic situation varies in different periods. It is more appropriate to analyse relative figures. In the same periods of time, the average annual FDI to GDP ratio was 10.4% under the Georgian Dream’s rule and 9.63% under the United National Movement’s rule. Therefore, taken this component, we can assume that the Georgian Dream’s rule has been more successful although the difference is substantially lower as compared to the figure named by the Minister of Economy and Sustainable Development.
At the same time, Natia Turnava’s approach successfully conceals the negative trend of the past two years which is a substantial decrease in FDI volume. In particular, the total FDI decreased by 35.5% in 2018 as compared to 2017 and this negative trend continued throughout 2019 with the drop in FDI in the first three quarters of 2019 constituting 18.6% as compared to the first three quarters of 2018. Averaging the data which means using the successful FDI figures from 2014 and 2017 conceals the negative trend of the last years. In addition, Ms Turnava makes emphasis on the third quarter taken separately where we have FDI growth whilst ignoring the total figure for the three quarters taken together which is also available (a 18.6%decrease in FDI).
Analysis
The Minister of Economy and Sustainable Development of Georgia, Natia Turnava, at the presentation of the Product of Georgia agency’s new investment strategy, Invest in Georgia 2020-2021, stated: “In the last seven years, the average annual volume of foreign direct investments in Georgia has increased by 35% as compared to the previous same period of time. The FDI to GDP ratio is three times higher in Georgia as compared to other countries of the region and the number of eastern countries. There is a double-digit growth of FDI in the third quarter and the volume of reinvested profit has practically doubled.”
Foreign direct investment (FDI) implies a resident of one country owning a share in a foreign-based enterprise and carrying out different types of economic operations related to that enterprise. An investor is considered to be a direct one if he has at least a 10% ownership stake in a foreign-based enterprise’s shares or the equivalent of such participation.
Currently, the FDI data for the first three quarters of 2019 are available and show that the total foreign direct investment in Georgia amounted to USD 909 million. The total sum of FDI in the first three quarters of 2019 is USD 185 million (16.9%) less as compared to the same period of the previous year. In regard to the third quarter of 2019, the growth of FDI reached 13.6% as compared to the same period of the previous year and the reinvestment figure has doubled from USD 125 million to USD 258 million.
Graph 1: Foreign Direct Investments in 2006-2019, Quarterly Data (mln USD)
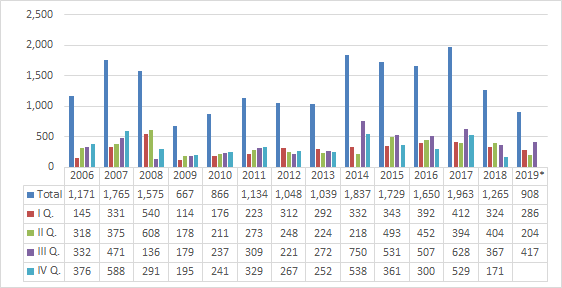
Source: National Statistics Office of Georgia
The FDI figures for 2019 are not fully available and so technically we can only calculate and compare the average figures for 2013-2018 and 2006-2012. In 2006-2012, the average annual volume of FDI was USD 1.17 billion and in 2013-2018 it was USD 1.58 billion, which constitutes a 34.5% growth. This growth does correspond to the figure named by Natia Turnava. However, a comparison of the absolute figures of FDI from different years is speculative and cannot be used as an indicator of a successful dynamic since the economic situation varies in different periods and, therefore, it is more appropriate to analyse relative figures. In the same periods of time, the average annual FDI to GDP ratio was 10.4% under the Georgian Dream’s rule and 9.63% under the United National Movement’s rule. Therefore, taken this component, we can assume that the Georgian Dream’s rule has been more successful. However, on the one hand, the Minister’s figure is exaggerated and, on the other hand, by averaging data Ms Turnava seeks to conceal thedrasticdrop in FDI in the last years by using the high figures in the initial years.
Graph 2: Growth of FDI as Compared to the Same Period of the Previous Year
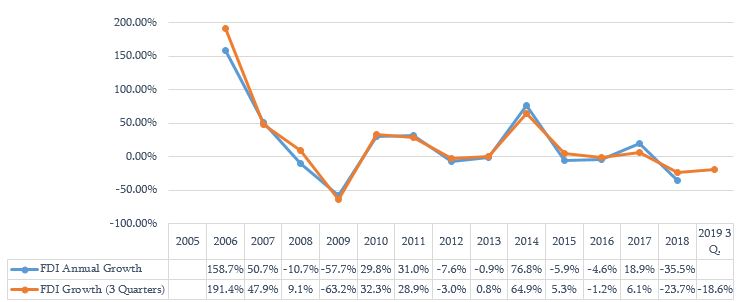
Source: National Statistics Office of Georgia
Graph 3: FDI (Net) to GDP Ratio in 2018, Europe and Central Asia Region Countries
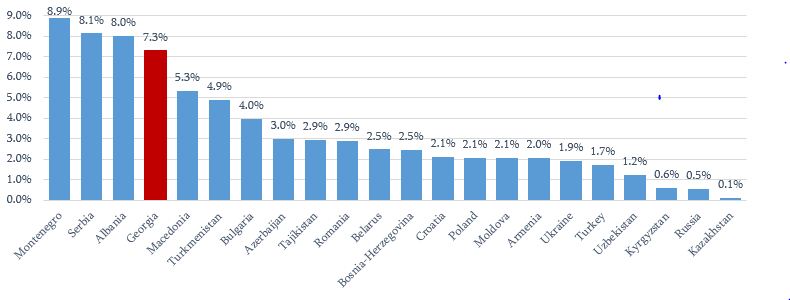
Source: World Bank