
Resume: In accordance with the preliminary data, total agricultural output in Georgia in 2018 was GEL 4 billion, which is 6.4% more as compared to 2017 figure and 43.8% more as compared to 2012 figure. Total output of products created as a result of processing of agriculture produce has also increased. In 2018 that figure amounted to GEL 5.3 billion, which is 4.2% more as compared to 2017 figure and 40.8% more as compared to 2012 figure.
However, in order to see progress in agriculture sector, it is appropriate to compare real added value created in the field to the same figure of the previous year. Employment of this method for comparison excludes growth of value as a result of increased prices (inflation). In accordance with the preliminary data of 2018, total GDP in agriculture amounted to GEL 1.759 billion in constant prices, which is GEL 12.7 million (0.7%) more as compared to the same figure of 2017.
In regard to the last years’ statistics, the highest figure of real agriculture growth was registered in 2013, when growth constituted 11.3% as compared to the previous year. Since 2013, real agriculture growth rate has been characterized with trend of decline and 3.8% drop was registered in 2017. In regard to 2018, as mentioned previously, real agriculture growth rate was only 0.7%.
In addition, share of agriculture in GDP has been decreasing annually since 2013 and in 2018 constituted 7.7% of the total economy. This means that other sectors of the economy have increased at higher rates as compared to agriculture. It is safe to conclude that against the backdrop of increased funding in 2013-2018, agriculture sector had a marginal growth in absolute figures, whilst its share in the total economy has decreased.
Analysis
The candidate for the Minister of Environmental Protection and Agriculture, Levan Davitashvili, spoke about achievements in agriculture before the joint session of the committees and stated: “In the last years, we have growing total agricultural output. There is an even bigger growth in a processing industry.”
In accordance with the preliminary data, total agricultural output in Georgia in 2018 was GEL 4 billion, which is 6.4% more as compared to 2017 figure and 43.8% more as compared to 2012 figure.
Table 1: Total Agriculture Output (GEL Million) and Total Output of Production Created as a result of Processing of Agriculture Products (GEL Million)
|
Year |
Total Agriculture Output (GEL Million) |
Total Output of Production Created as a result of Processing of Agriculture Products (GEL Million) |
|
2012 |
2,807 |
3,735 |
|
2013 |
3,210 |
3,983 |
|
2014 |
3,387 |
4,567 |
|
2015 |
3,653 |
4,513 |
|
2016 |
3,854 |
4,763 |
|
2017 |
3,796 |
5,045 |
|
2018 |
4,037 |
5,258 |
Source: National Statistics Office of Georgia
In accordance with the preliminary data of 2018, added value created in agro-food sector amounts to GEL 4.9 billion in current prices, which is 6.1% as compared to 2017 figure and 48.7% more as compared to 2012 figure. In accordance with the preliminary data of 2018, share of agro-food sector in total GDP is 13.8%. The same figure in 2017 was 14.2%, whilst in 2012 it was 14.6%.
Graph 1: Added Value Created in Agro-Food Sector
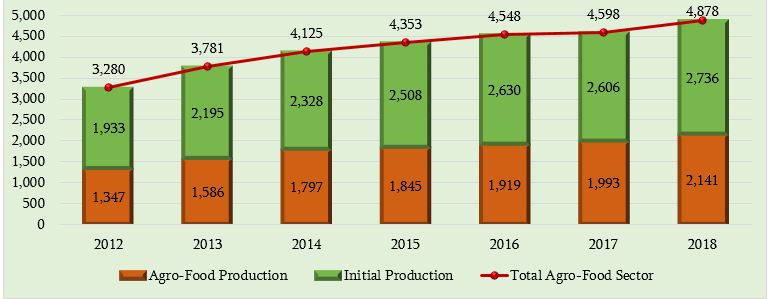
Source: National Statistics Office of Georgia
Country’s economic growth is measured by changes in real added value. Real agriculture growth (change in production volumes as compared to the previous year) shows how the sector output has been changing minus the impact of price changes. Therefore, in order to see progress in agriculture sector, it is appropriate to compare real added value created in the field to the same figure of the previous year. Employment of this method for comparison excludes growth of value as a result of increased prices (inflation). In accordance with preliminary data of 2018, total GDP in agriculture amounted to GEL 1.759 billion in constant prices, which is GEL 12.7 million (0.7%) more as compared to the same figure of 2017.
Graph 2: Real Agriculture Growth in 2012-2018
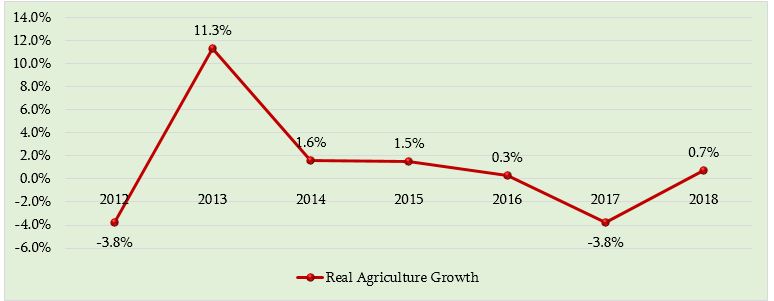
Source: National Statistics Office of Georgia
The highest figure of real agriculture growth was registered in 2013, when growth constituted 11.3% as compared to the previous year. Since 2013, real agriculture growth rate has been characterized with trend of decline and 3.8% drop was registered in 2017. In regard to 2018, as mentioned previously, real agriculture growth rate was only 0.7%. Share of agriculture in GDP has been decreasing annually since 2013 and in 2018 constituted 7.7% of the total economy.
Graph 3: Share of Agriculture in GDP in 2012-2018
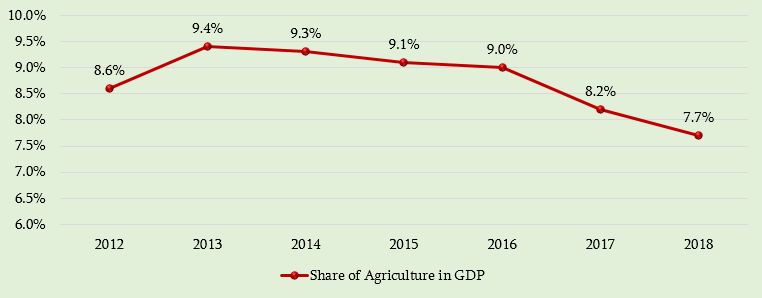
Source: National Statistics Office of Georgia
Since 2012 (the last year of the United National Movement’s tenure in power), government has started to increase funding for agriculture. In 2011, agriculture spending was GEL 39.9 million. This figure increased to GEL 212.8 million in 2012. Despite a sharp growth in funding, agriculture output decreased by 3.8% in 2012. In 2012-2017, agriculture sector spending to state budget expenditures ratio was 2.5% on average, which decreased to 1.8% in 2018 and it is planned to be at 1.7% in 2019.
In 2013-2018, against the backdrop of increased funding, agriculture sector had a marginal growth in absolute figures, whilst its share in the total economy has decreased.