

Resume: The main factor which stipulates the current account deficit in Georgia has historically always been the negative trade balance in trade of goods. In 2011-2012 prior to the change of government, import exceeded export by 3.2 and 3.4 times, respectively. As of today, import exceeds export by a factor of 2.7. Despite this, the more important indicator – the trade deficit to GDP ratio – has not changed significantly. In 2011-2012, this ratio was 33.8% and 35.8%, respectively. In the following periods, the trade deficit to GDP ratio has been stable and constituted 34.5% and 35.6%, respectively, in 2017 and 2018.
A negative trade balance is partially offset by other components of the current account, usually the positive balance of trade in service. In regard to the current account deficit per se, with -12.8% and -11.9% negative balances in 2011 and 2012, respectively, Georgia was ranked in the 33rd and 30th positions from the bottom from among 180 territorial units. In 2017-2018, the current account deficit decreased substantially, to -8.8% and -7.7%, respectively, in these years. Even in light of a better performance, however, Georgia’s positions vis-à-vis other countries has not improved. Of additional note is that this is a somehow rigid approach which does not take into account the individual characteristics of different countries’ economies. In particular, less-developed and oil-rich countries usually have their current account at a surplus at the expense of their large share of the exports of their natural resources.
Bakhtadze’s figures largely correspond to the reality. The current account deficit as well as the import and export ratio has always been a historical problem for Georgia’s economy and the current situation has not improved substantially. However, the Prime Minister’s quote also does not include such a claim.
Analysis
On air on TV Pirveli’s broadcast, Reaktsia, the Prime Minister of Georgia, Mamuka Bakhtadze, remarked that they (the Georgian Dream) inherited a difficult legacy, meaning a dependence on import. As stated by the Prime Minister, import was thrice as large as exports whilst Georgia had one of the worst parameters in the world in terms of the current account deficit.
The current account illustrates a certain part of economic relations outcomes between a particular country and the rest of the world whilst a country’s balance of payments includes comprehensive data about money inflows and outflows. The balance of payments is a certain account which illustrates the movement of money between the economy of a specific country and the rest of the world. A country’s balance of payments consists of its current account, capital account and financial account.
A current account includes the component of trading with goods and services as well as incomes and transfers. The income component shows inflows of income from abroad (specifically, labour remuneration and investment income) and incomes transferred from Georgia. Transfers include current transfers between the residents and non-residents of a country (for instance grants, financial assistance). A capital account consists of purchase/assignations of capital transfers and non-produced non-financial assets. One of the forms of capital transfers is the forgiveness of debt. A financial account includes direct investments, portfolio investments, financial derivatives, other investments and reserve assets. If a country’s current account is with a deficit; that is, if more money leaves the country as compared to what comes in, the gap is covered by the financial account (by investments, taking debt and a decrease in monetary reserves). The use of foreign debt to fund the current account deficit is the least desirable scenario. Table 1 illustrates trend of changes in the current account deficit.
Table 1: Current Account Deficit
|
2010 |
2011 |
2012 |
2013 |
2014 |
2015 |
2016 |
2017 |
2018 |
|
|
GDP (GEL Million |
20,743 |
24,344 |
26,167 |
26,847 |
29,150 |
31,756 |
34,028 |
37,847 |
41,077 |
|
GDP (USD Million) |
11,637 |
14,438 |
15,848 |
16,140 |
16,508 |
13,988 |
14,378 |
15,088 |
16,207 |
|
Current Account (USD Million) |
-1,195 |
-1,843 |
-1,886 |
-958 |
-1,789 |
-1,763 |
-1,889 |
-1,333 |
-1,247 |
|
Current Account to GDP Ratio (%) |
-10.3% |
-12.8% |
-11.9% |
-5.9% |
-10.8% |
-12.6% |
-13.1% |
-8.8% |
-7.7% |
Source: National Bank of Georgia, National Statistics Office of Georgia
In 2018, the current account deficit constituted USD 1.25 billion which is 7.7% of the GDP. This figure is an improvement by 1.1 percentage points as compared to 2017. The current account deficit was characterised by a decrease trend in 2011-2013, too, and it dropped sharply to 5.9% as of 2013 whilst it returned to the growth trend in 2014-2016. In 2017-2018 again, there is a deficit decrease dynamic.
In regard to a comparison of countries in terms of the current account deficit, naturally it is desirable to keep that figure low. Given the differences in the size of the economies, certain countries’ absolute figures vis-à-vis their current account deficit or surplus are incomparable. It is appropriate to employ the current account to GDP ratio. To directly compare certain countries with this indicator is permissible although it is somewhat of a rough approach. Countries rich with natural resources (mostly petroleum products), such as Kuwait, Azerbaijan, Russia and Saudi Arabia, usually have a current account surplus given the large share of the export of their resources. In regard to Georgia’s current account deficit vis-à-vis other countries, Georgia was ranked 33rd and 30th from the bottom from among 180 territorial units in 2011-2012 (years prior to the change of government). In the last years, despite a trend of decrease in the current account deficit, Georgia’s position in the given ranking did not change significantly (29th position in 2017 ).
In regard to the import and export ratio, the trade in goods is one of the components of the current account and it has historically been the major factor stipulating Georgia’s current account deficit. Graph 1 illustrates the trend of changes in import and export in Georgia.
Graph 1: Import and Export Ratio
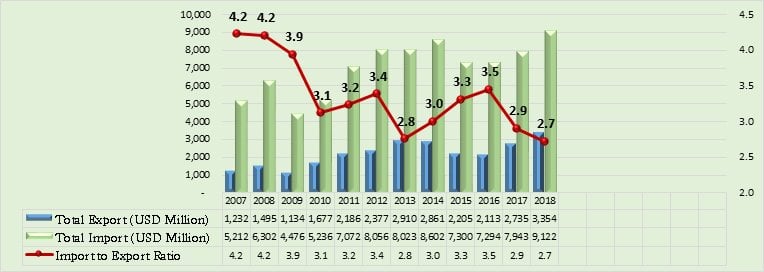
Source: National Statistics Office of Georgia
As illustrated by the graph, in years prior to the change of the government (2011-2012), import exceeded export by 3.2 and 3.4 times, respectively, in these years. In 2013, this ratio gradually dropped to 2.8 and returned to a growth trend. As a result, the ratio in 2016 is higher than 2012 and constitutes 3.5. In 2017-2018, there is again a decrease trend and import exceeds export by 2.9 and 2.7 times, respectively, in these years. The trade deficit (export minus import) to GDP ratio is a more important indicator as compared to the export to import ratio and respective data are given in Graph 2.
Graph 2: Trade Deficit to GDP Ratio
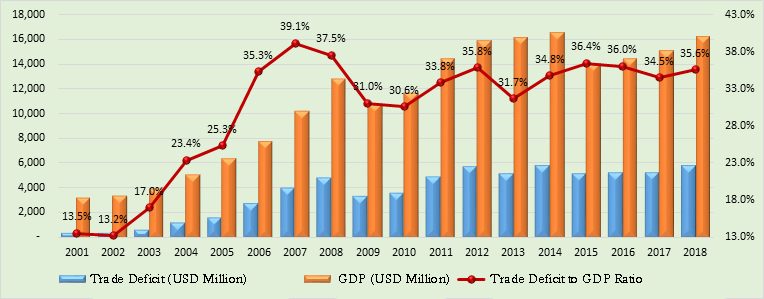
Source: National Statistics Office of Georgia
In 2011-2012, the current account deficit to GDP ratio was 33.8% and 35.8%, respectively, in these years. In the following periods, the trade balance to GDP ratio has been relatively stable and constituted 34.5% and 35.6%, respectively, in 2017-2018.