Verdict: FactCheck concludes that Giorgi Kandelaki’s statement is MOSTLY TRUE.
Resume: Despite the Government of Georgia’s significant interventions in the agriculture sector (funding for agriculture nearly doubled as compared to the past years), the real agriculture growth rate has still been declining since 2013 with agriculture having decreased (in value) in 2017. Furthermore, the agriculture to GDP ratio has also been declining since 2013. The lowest figure after 2008 was registered in 2017 when agriculture constituted 8.2% of Georgia’s economy.
In addition, despite the Small Farmers Spring Work Assistance Programme with quite a large budget of GEL 354 million, the area of cultivated land has been declining as well. The area of cultivated land in 2017 shrank by 8.4% as compared to the previous year.
The production of fruits and vegetables also dropped in 2017 (only grape production increased) by 39% and 11.4%, respectively. Milk production also experiences a decline (dropped by 2.2%) whilst there is only a marginal increase in meat and egg production by 0.15% and 1.6%, respectively.
Giorgi Kandelaki has named incorrect figures although the overarching context of the statement does indeed correspond to the truth.
Analysis
European Georgia – Movement for Freedom MP, Giorgi Kandelaki, at the session of the Parliament of Georgia spoke about agriculture and stated: “In 2017, agriculture decreased by every parameter. It applies to the size of agriculture and the area of cultivated land as well. For instance, the area of cultivated land shrank by 17%, fruit production decreased by 38%, vegetable production decreased by 19%, milk production decreased by 11% and meat production decreased by 10%. And this decrease happened in spite of tens and hundreds of millions of GEL that the Government of Georgia had spent; for instance, in the land cultivation programme.”
In 2017, the total agriculture output in Georgia reached GEL 3,921.6 million (in current prices) which is 1.8% more as compared to the previous year’s figure (GEL 3,854 million). However, these figures are not relevant for measuring the real agriculture growth because production output is calculated in current prices and, therefore, does not exclude the increase of value because of increased prices (inflation).
In order to measure progress in the agriculture sector, it is necessary to compare agriculture’s added value to the same figure of the previous year. Using this method for comparison does not take into account (excludes) the value increase which was caused because of increased prices (inflation). The real growth of agriculture (change in output as compared to the previous year) illustrates how agriculture output changes without being affected by price changes. The real agriculture growth rate in 2017 is negative as compared to the previous year with agriculture output having decreased by 2.7%. In 2016, the real agriculture growth was only 0.3% (see the article). Furthermore, the agriculture to GDP ratio has also been declining since 2013. The lowest figure after 2008 was registered in 2017 when agriculture constituted 8.2% of Georgia’s economy.
In order to have a detailed analysis of the current processes in agriculture, it is important to take into account the statistics in regard to cultivated land areas.
Table 1: Cultivated Land Area in 2013-2017 (Thousand Hectares)
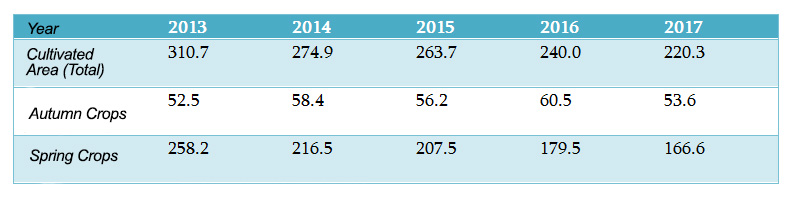 Source: National Statistics Office of Georgia
In accordance with the data of the National Statistics Office of Georgia, the area of cultivated land plots has been shrinking since 2013 (in spite of the state-sponsored Small Farmers Spring Work Support Programme with quite a lucrative GEL 354 million budget). The cultivated area for both autumn and spring crops has been shrinking as well. In 2017, the total area of cultivated land shrank by 8.4% as compared to the previous year.
The figures of production for one-year and multi-year crops are as follows:
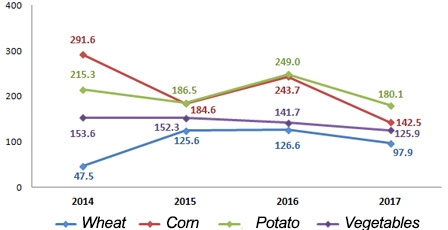
Graph 1: Production of One-Year Crops (Thousand Tons)
Source: National Statistics Office of Georgia
In accordance with the data of the National Statistics Office of Georgia, the area of cultivated land plots has been shrinking since 2013 (in spite of the state-sponsored Small Farmers Spring Work Support Programme with quite a lucrative GEL 354 million budget). The cultivated area for both autumn and spring crops has been shrinking as well. In 2017, the total area of cultivated land shrank by 8.4% as compared to the previous year.
The figures of production for one-year and multi-year crops are as follows:
Graph 1: Production of One-Year Crops (Thousand Tons)
 Source: National Statistics Office of Georgia
In accordance with the graph, the production of wheat, corn and potatoes has decreased. Of the crops given in the graph, the production of vegetables, in particular, decreased by 11.4% as compared to the previous year.
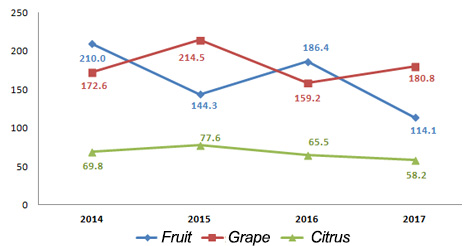
Graph 2: Production of Multi-Year Crops (Thousand Tons)
Source: National Statistics Office of Georgia
In accordance with the graph, the production of wheat, corn and potatoes has decreased. Of the crops given in the graph, the production of vegetables, in particular, decreased by 11.4% as compared to the previous year.
Graph 2: Production of Multi-Year Crops (Thousand Tons)
 Source: National Statistics Office of Georgia
Of the multi-year crops, only grape production increased. In 2017, fruit production dropped by 39% as compared to the previous year.
It is important to analyse the dynamics of farming production as well.
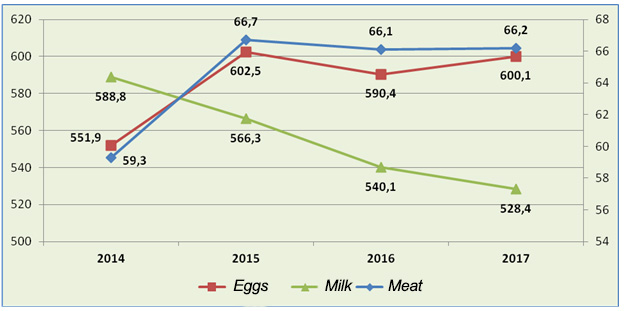
Graph 3: Production of Meat (Thousand Tons), Milk (Million Litres) and Eggs (Million Pieces) in 2014-2017
Source: National Statistics Office of Georgia
Of the multi-year crops, only grape production increased. In 2017, fruit production dropped by 39% as compared to the previous year.
It is important to analyse the dynamics of farming production as well.
Graph 3: Production of Meat (Thousand Tons), Milk (Million Litres) and Eggs (Million Pieces) in 2014-2017
 Source: National Statistics Office of Georgia
As illustrated by the graph, the production of milk has been experiencing a decline in the past years. In 2017, milk production decreased by 2.2% as compared to the previous year. In regard to meat and egg production, there is no explicit trend here and production volumes fluctuate over time. In 2017, the production of eggs and meat increased marginally as compared to the previous year; by 1.6% and 0.15%, respectively.
The Ministry of Agriculture of Georgia spent GEL 1.437 million in 2013-2017. The funding allocated for agriculture started to increase in 2012 and the share of funding for the Ministry of Agriculture in 2013-2017 was 3.64% on average in Georgia’s state budget (in 2004-2012, the share of agriculture funding in the budget was 1.59% on average).
Source: National Statistics Office of Georgia
In accordance with the data of the National Statistics Office of Georgia, the area of cultivated land plots has been shrinking since 2013 (in spite of the state-sponsored Small Farmers Spring Work Support Programme with quite a lucrative GEL 354 million budget). The cultivated area for both autumn and spring crops has been shrinking as well. In 2017, the total area of cultivated land shrank by 8.4% as compared to the previous year.
The figures of production for one-year and multi-year crops are as follows:
Graph 1: Production of One-Year Crops (Thousand Tons)
Source: National Statistics Office of Georgia
In accordance with the graph, the production of wheat, corn and potatoes has decreased. Of the crops given in the graph, the production of vegetables, in particular, decreased by 11.4% as compared to the previous year.
Graph 2: Production of Multi-Year Crops (Thousand Tons)
Source: National Statistics Office of Georgia
Of the multi-year crops, only grape production increased. In 2017, fruit production dropped by 39% as compared to the previous year.
It is important to analyse the dynamics of farming production as well.
Graph 3: Production of Meat (Thousand Tons), Milk (Million Litres) and Eggs (Million Pieces) in 2014-2017
Source: National Statistics Office of Georgia
As illustrated by the graph, the production of milk has been experiencing a decline in the past years. In 2017, milk production decreased by 2.2% as compared to the previous year. In regard to meat and egg production, there is no explicit trend here and production volumes fluctuate over time. In 2017, the production of eggs and meat increased marginally as compared to the previous year; by 1.6% and 0.15%, respectively.
The Ministry of Agriculture of Georgia spent GEL 1.437 million in 2013-2017. The funding allocated for agriculture started to increase in 2012 and the share of funding for the Ministry of Agriculture in 2013-2017 was 3.64% on average in Georgia’s state budget (in 2004-2012, the share of agriculture funding in the budget was 1.59% on average).
Tags: