

Verdict: FactCheck concludes that Irakli Kobakhidze’s statement is MOSTLY TRUE.
Resume: In 2012-2017, the real GDP per capita increased by 20.2%; that is, from GEL 6,343.4 to GEL 7,624. This figure, if denominated in the USD average exchange rate in 2010, shows that Georgia’s GDP per capita increased from USD 3,558.5 to USD 4,276.9.[1] The methodology which Irakli Kobakhidze presumably used to measure the GDP per capita in USD is objective and gives a real picture. However, the figures he named lack precision because he deducted USD 58.5 from the 2012 figure and added USD 223.1 to the 2017 figure in order to round up the number.
Given the aforementioned indicators, Irakli Kobakhidze also speaks about the objective factors of poverty in the country. Within this context, it is important to take a look at the World Bank’s gross national income (GNI) per capita figures. In 2012, Georgia’s GNI per capita was USD 3,870 and it was growing in the following years. In 2017, however, it decreased to USD 3,790. Until 2015, Georgia belonged to the group of lower-middle income countries (II category) whilst it moved to the III category of upper-middle income countries in 2015. As of 2017, however, Georgia was again relegated to the group of lower-middle income countries.
Analysis
The Speaker of the Parliament of Georgia, Irakli Kobakhidze, whilst discussing the country’s economic situation, talked about poverty figures and the GDP per capita. He stated that the GDP per capita was USD 3,500 in 2012 and now constitutes USD 4,500. Mr Kobakhidze also underlined the reasons behind Georgia’s poverty and stated that the 20% poverty figure is only natural when the GDP per capita was USD 4,500.
The gross domestic product (GDP) shows the total amount of goods and services intended for final consumption which measures a country’s size and scale of economy. In addition, the GDP per capita is one of the indicators of the quality of life in a given country. In order to exclude the inflation effect whilst measuring the GDP, it is measured in constant prices for 2010 and denominated in the national currency. This shows the real volume of a country’s economy.
In 2012, the real GDP per capita was GEL 6,343.4 and it increased to GEL 7,624 by 2017. Therefore, the real GDP per capita increased by GEL 1,280.6 in 2012-2017 which constitutes a 20.2% growth. Of note is that the growth of the GDP per capita is not caused by a declining population because Georgia’s population increased by 11,200 persons in that period.
Graph 1: Real GDP per Capita (GEL, USD)
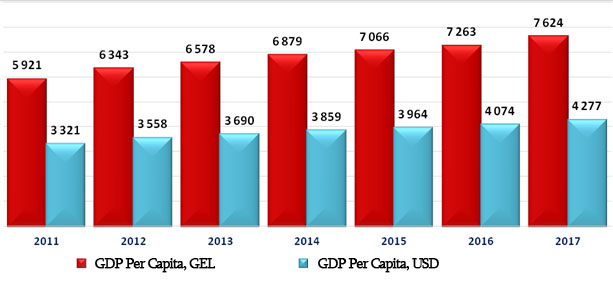 Source: National Statistics Office of Georgia
In most cases, measuring the GDP in a foreign currency is not objective because the effect of the exchange rate is not excluded. However, taking into account the figures given in Irakli Kobakhidze’s statement, the exchange rate effect has been excluded because the figures are calculated according to the constant average exchange rate for 2010. Therefore, using this method gives an objective GDP per capita figure in a foreign currency and depicts a real situation.
Because Irakli Kobakhidze speaks about the GDP within the context of poverty which is measured by incomes distributed among the population, it would be appropriate to consult the GNI[2] per capita figures as calculated by the World Bank’s Atlas method. The World Bank uses figures calculated by this method in order to group countries in terms of their levels of income. The GNI is converted by a special exchange rate and not by the simple exchange rate whilst inflation and changes in the currency exchange are excluded. This makes the figure more realistic although the substantial influence of changes in the exchange rate is still maintained and which complicates the analysis over time.
Source: National Statistics Office of Georgia
In most cases, measuring the GDP in a foreign currency is not objective because the effect of the exchange rate is not excluded. However, taking into account the figures given in Irakli Kobakhidze’s statement, the exchange rate effect has been excluded because the figures are calculated according to the constant average exchange rate for 2010. Therefore, using this method gives an objective GDP per capita figure in a foreign currency and depicts a real situation.
Because Irakli Kobakhidze speaks about the GDP within the context of poverty which is measured by incomes distributed among the population, it would be appropriate to consult the GNI[2] per capita figures as calculated by the World Bank’s Atlas method. The World Bank uses figures calculated by this method in order to group countries in terms of their levels of income. The GNI is converted by a special exchange rate and not by the simple exchange rate whilst inflation and changes in the currency exchange are excluded. This makes the figure more realistic although the substantial influence of changes in the exchange rate is still maintained and which complicates the analysis over time.
 Source: World Bank National Accounts Data
Apart from the aforementioned, the World Bank classifies countries in terms of their income which in turn depends on the GNI per capita figures. There are four categories for countries in terms of income: low income, lower-middle income, upper-middle income and high income. In these categories, the GNI per capita range changes over time and these changes are related to a variety of factors. In 2003-2014, the World Bank classified Georgia as a lower-middle income country whilst it was moved to an upper-middle income country in 2015. Since 2016, Georgia has still been categorised as a lower-middle income country.
[1] The USD average exchange rate in 2010 is used to measure the real GDP per capita in USD. As a result, the GDP per capita figure will be real and the exchange rate effect will be excluded.
[2] The gross national income measures the value added as created by country residents both within and outside the country. The difference between the GDP and the GNI is the difference between the income received by residents of Georgia living abroad (including income from employment, property, etc.) and the income received by foreign residents living in Georgia.
Source: World Bank National Accounts Data
Apart from the aforementioned, the World Bank classifies countries in terms of their income which in turn depends on the GNI per capita figures. There are four categories for countries in terms of income: low income, lower-middle income, upper-middle income and high income. In these categories, the GNI per capita range changes over time and these changes are related to a variety of factors. In 2003-2014, the World Bank classified Georgia as a lower-middle income country whilst it was moved to an upper-middle income country in 2015. Since 2016, Georgia has still been categorised as a lower-middle income country.
[1] The USD average exchange rate in 2010 is used to measure the real GDP per capita in USD. As a result, the GDP per capita figure will be real and the exchange rate effect will be excluded.
[2] The gross national income measures the value added as created by country residents both within and outside the country. The difference between the GDP and the GNI is the difference between the income received by residents of Georgia living abroad (including income from employment, property, etc.) and the income received by foreign residents living in Georgia.
Source: National Statistics Office of Georgia
In most cases, measuring the GDP in a foreign currency is not objective because the effect of the exchange rate is not excluded. However, taking into account the figures given in Irakli Kobakhidze’s statement, the exchange rate effect has been excluded because the figures are calculated according to the constant average exchange rate for 2010. Therefore, using this method gives an objective GDP per capita figure in a foreign currency and depicts a real situation.
Because Irakli Kobakhidze speaks about the GDP within the context of poverty which is measured by incomes distributed among the population, it would be appropriate to consult the GNI[2] per capita figures as calculated by the World Bank’s Atlas method. The World Bank uses figures calculated by this method in order to group countries in terms of their levels of income. The GNI is converted by a special exchange rate and not by the simple exchange rate whilst inflation and changes in the currency exchange are excluded. This makes the figure more realistic although the substantial influence of changes in the exchange rate is still maintained and which complicates the analysis over time.
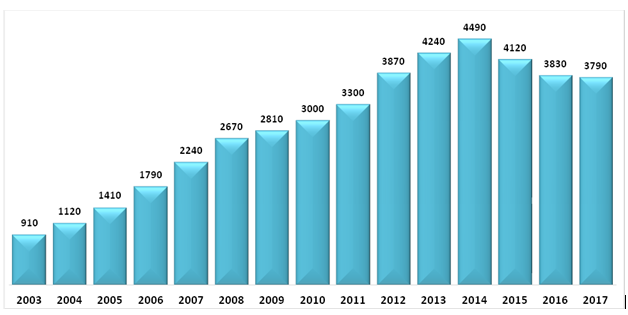
In 2012, the GNI per capita was USD 3,870 and this figure increased over the next two years, reaching USD 4,490 in 2014. However, the figure decreased in subsequent years and dropped to USD 3,790 in 2017. With the 2017 figures, Georgia was 142nd in the world whilst it occupied the 117th position in 2012.
Graph 2: GNI per Capita (Atlas Method, USD)
Source: World Bank National Accounts Data
Apart from the aforementioned, the World Bank classifies countries in terms of their income which in turn depends on the GNI per capita figures. There are four categories for countries in terms of income: low income, lower-middle income, upper-middle income and high income. In these categories, the GNI per capita range changes over time and these changes are related to a variety of factors. In 2003-2014, the World Bank classified Georgia as a lower-middle income country whilst it was moved to an upper-middle income country in 2015. Since 2016, Georgia has still been categorised as a lower-middle income country.
[1] The USD average exchange rate in 2010 is used to measure the real GDP per capita in USD. As a result, the GDP per capita figure will be real and the exchange rate effect will be excluded.
[2] The gross national income measures the value added as created by country residents both within and outside the country. The difference between the GDP and the GNI is the difference between the income received by residents of Georgia living abroad (including income from employment, property, etc.) and the income received by foreign residents living in Georgia.
Tags: