

Verdict:FactCheck concludes that Mikheil Saakashvili’s statement is HALF TRUE.
Resume: In 2003-2012, the GEL denominated absolute figure for the national debt[1] increased by 69% and the government debt increased by 78%. Under the Georgian Dream’s government, national debt growth reached 86% whilst government debt growth constitutes 96%. However, it seems that the former President speaks about the relative figures of debt instead of the absolute figures.
In general whilst discussing debt, it is appropriate to use relative and not absolute figures because a specific absolute number could be very big for a small-size economy and marginal for a large economy. In order to properly assess the debt burden, the total debt to GDP ratio is used. In 2003, Georgia’s national debt to GDP ratio was 63.3%. In 2012, this figure decreased by 45% (28.5 percentage points) to 34.83%. In the same period, the government debt to GDP ratio decreased by 43% (24 percentage points). Under the Georgian Dream’s government, the national debt to GDP ratio increased by 28% (9.8 percentage points) and the government debt by 35% (11.4 percentage points) which means growth by the factors of 1.28 and 1.35, respectively. Therefore, in the case of an analysis of relative figures, the trend of changes is compatible with the content of Mikheil Saakashvili’s statement, although the figures he names are exaggerated.
At the same time, the GEL exchange rate in the last years needs to be taken into account because it has a significant impact upon GEL denominated debt figures. In turn, the fluctuation of the GEL exchange rate, which started at the end of 2014, was mostly stipulated by factors which were beyond the Government of Georgia’s ability to influence. However, certain actions or inactions of the government exerted an additional negative influence upon GEL depreciation.
Analysis
On 1 October 2018, on air on the talk show, Archevani, Mikheil Saakashvili stated: “In my time, debt decreased by 50% as compared to Shevardnadze’s time whilst the Georgian Dream doubled the debt.”
The Ministry of Finance of Georgia publishes statistical data about state debt.
Graph 1: National Debt and Government Debt (GEL Million) in 2003-2017
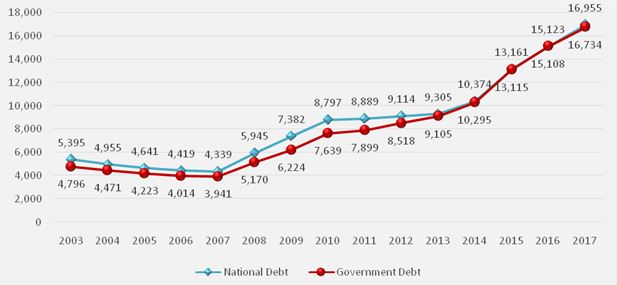
Source:Ministry of Finance
Under the United National Movement’s government, the GEL denominated absolute figure of national debt increased by 69% and government debt increased by 78%. Under the Georgian Dream’s government, national debt growth reached 86% whilst government debt growth constitutes 96%. The former President of Georgia has not specified whether or not he referred to the national debt or the government debt but the dynamic is identical in both cases.
Whilst discussing national and government debt, we use relative figures and not absolute figures because a specific absolute number could be very big for a small-size economy and marginal for a large economy. Using the total debt to GDP ratio enables us to properly assess a debt burden. Perhaps Mikheil Saakashvili was speaking about relative figures in his statement.
We need to see the total debt to GDP ratio in order to fully assess the debt burden. The respective data are given in Graph 2. In 2003, Georgia’s national debt to GDP ratio was 63.3%. In 2012, this figure decreased by 45% (28.5 percentage points) to 34.83%. In the same period, the government debt to GDP ratio decreased by 43% (24 percentage points). In 2012-2017, the national debt to GDP ratio increased by 28% (9.8 percentage points) and the government debt by 35% (11.4 percentage points) which means growth by the factors of 1.28 and 1.35, respectively.
Graph 2: National and Government Debt to GDP Ratio
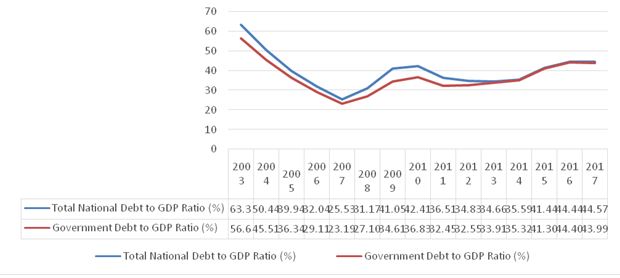
Source: Ministry of Finance
Whilst noting the growth of debt, the fluctuation of the GEL exchange rate in a given period is an important factor. In particular, as a result of exchange rate changes, a new exchange rate is applied for calculation at the end of a reporting period – not only for newly added debt in the aforementioned period but for the entire volume of already accumulated debt. Therefore, the growth of government debt was largely stipulated by a re-calculation of the pre-2012 accumulated government debt in accordance with the new exchange rate. In other words, if the Government of Georgia had not taken any more debt (inflow) as compared to debt payments (outflows) since 2013, the GEL denominated debt figure would have increased in any case. Therefore, the debt growth was largely stipulated by using the increased exchange rate to re-calculate the already accumulated debt.
In regard to currency exchange rate changes in themselves, the USD index increased substantially in the given period which resulted in USD appreciating against all other currencies of the world. Apart from the direct impact of USD appreciation, there is also the indirect impact which needs to be considered as well. In particular, when the currencies of Georgia’s top trading partners depreciate, this leads to a deterioration of Georgia’s foreign trade conditions and it increases the negative trade balance which in turn contributes to GEL depreciation. The difficult situation in the region and in the country’s partner nations also negatively affected currency inflows and, by extension, the GEL exchange rate as well. The Government of Georgia was unable to significantly deal with those external factors. However, certain actions (low economic growth rate, restricted visa regimes with a number of countries, unequal spending of state finances, etc.) or the inactions of the government also created additional pressure on the GEL exchange rate (see link 1; link 2).
For further information, given the GDP growth rate, domestic debt to GDP ratio would have increased if we exclude the exchange rate effect for debt accumulated by December 2012 although the foreign debt to GDP ratio would have decreased. Georgia’s nominal GDP grew by 45.38% in 2017 as compared to 2012 whilst the net growth of the country’s foreign debt in the same period was only 44.35%. In other words, Georgia’s economy grew faster in 2013-2017 as compared to its foreign debt. Therefore, the foreign debt to GDP ratio would have decreased without the exchange rate effect for debt accumulated as of December 2012.
Table 1: Government Debt without Exchange Rate Effect (GEL, Thousand)
| Period | 2012 | 2013 | 2014 | 2015 | 2016 | 2017 |
| Government Foreign Debt | 6,622 | 6,748 | 7,281 | 7,975 | 8,687 | 9,559 |
| Net Flows | - | 126 | 533 | 694 | 712 | 872 |
| Foreign Debt to GDP Ratio | 25.31% | 25.13% | 24.98% | 25.11% | 25.53% | 25.13% |
| Government Domestic Debt | 1,896 | 2,010 | 2,548 | 2,828 | 3,171 | 3,535 |
| Domestic Debt to GDP Ratio | 7.24% | 7.49% | 8.74% | 8.90% | 9.32% | 9.29% |
| Total Government Debt | 8,518 | 8,758 | 9,828 | 10,803 | 11,858 | 13,095 |
| Total Debt to GDP Ratio | 32.55% | 32.62% | 33.72% | 34.02% | 34.85% | 34.42% |
Source: Ministry of Finance
As illustrated by the table, the decrease in the foreign debt to GDP ratio would not have fully offset the domestic debt growth effect and the total government debt to GDP ratio would have increased in any case by 1.87 percentage points to 34.42%.
[1] The total national debt is the sum of the total foreign debt (including the debt of the National Bank) and domestic debt. In contrast to the national debt, the total government debt does not include the obligations of the National Bank.