On 10 May 2016 one of our readers addressed us with a request to check whether or not the ratings of the opposition political parties have indeed been growing. We used the surveys of the National Democratic Institute (NDI) in order to analyse this issue.
The results of the most recent survey conducted by the National Democratic Institute were published on 14 April 2016. The part of the survey concerning the ratings of Georgian political parties has prompted various types of responses from the Georgian political sector. Some of the opposition parties (Alliance of Patriots and the Democratic Movement – United Georgia) and the ruling coalition distrust the results of the survey. Another part of the opposition parties (United National Movement, Free Democrats, Girchi and others) believe that NDI’s survey captures the actual situation rather well.
According to one of the leaders of the United National Movement, Sergo Ratiani, the ratings of the Georgian Dream coalition are dropping catastrophically whilst the ratings of the United National Movement are growing.
According to Free Democrats party member, Zurab Abashidze, the ratings of his party are slowly rising. "There is a big chance that a large part of the yet undecided voters will choose to support the Free Democrats as the base of our voters is also quite solid and our ratings are slowly rising," said Mr Abashidze.
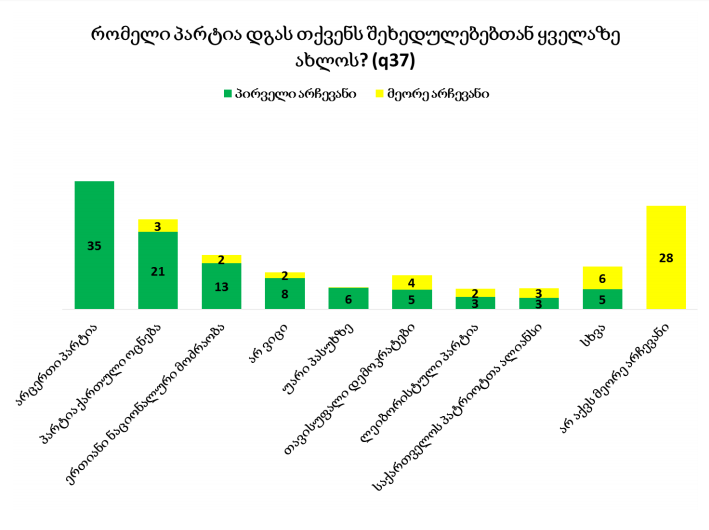
The most recent survey by the National Democratic Institute was conducted all around Georgia from 23 February 2016 to 14 March 2016. The answers to one of the main questions, If Parliamentary elections were held tomorrow, which party would you vote for? (whole sample), looked like this: Georgian Dream coalition (the survey was conducted before the breakup of the coalition) – 15%, United National Movement – 13% and the Free Democrats – 6%.
Chart 1: Ratings of Political Parties According to NDI’s Spring 2016 Survey
 As for the results of the previous survey published in November 2015, the same question got the following answer (see Chart 2): Georgian Dream coalition – 16%, United National Movement – 10% and the Free Democrats – 7%.
Chart 2: Ratings of Political Parties According to NDI’s November 2015 Survey
As for the results of the previous survey published in November 2015, the same question got the following answer (see Chart 2): Georgian Dream coalition – 16%, United National Movement – 10% and the Free Democrats – 7%.
Chart 2: Ratings of Political Parties According to NDI’s November 2015 Survey
 As we can see, the ratings of the Georgian Dream coalition and the Free Democrats saw little changes in spring 2016 as compared to November 2015 (the difference is only about 1%) whilst support grew by 3% in the case of the United National Movement.
FactCheck also took interest in the ratings of the political parties several months after the 2012 Parliamentary elections. In November 2012 the National Democratic Institute conducted a survey in which one of the main questions was Which party is closest to you? with the answers looking like this: Georgian Dream coalition – 63% and the United National Movement – 10% (see Chart 3).
Chart 3: Ratings of Political Parties According to NDI’s November 2012 Survey
As we can see, the ratings of the Georgian Dream coalition and the Free Democrats saw little changes in spring 2016 as compared to November 2015 (the difference is only about 1%) whilst support grew by 3% in the case of the United National Movement.
FactCheck also took interest in the ratings of the political parties several months after the 2012 Parliamentary elections. In November 2012 the National Democratic Institute conducted a survey in which one of the main questions was Which party is closest to you? with the answers looking like this: Georgian Dream coalition – 63% and the United National Movement – 10% (see Chart 3).
Chart 3: Ratings of Political Parties According to NDI’s November 2012 Survey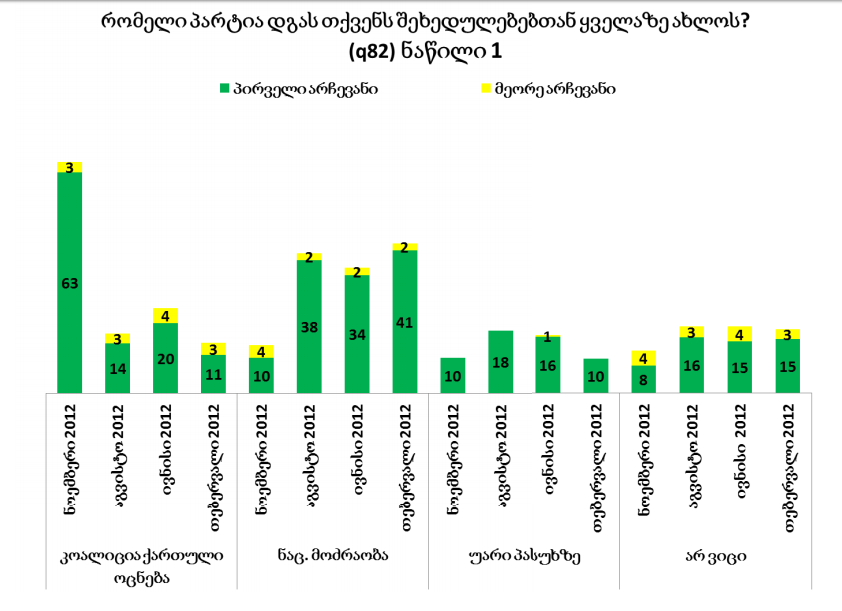 The answers to the question, Which party is closest to you?, in the April 2015 survey looked like this: Georgian Dream coalition – 21%, United National Movement – 13% and the Free Democrats – 5%.
Chart 4: Ratings of Political Parties According to NDI’s April 2015 Survey
The answers to the question, Which party is closest to you?, in the April 2015 survey looked like this: Georgian Dream coalition – 21%, United National Movement – 13% and the Free Democrats – 5%.
Chart 4: Ratings of Political Parties According to NDI’s April 2015 Survey
 As for the most recent survey, the question about the ratings of the parties received the following distribution of answers: Georgian Dream coalition – 16%, United National Movement – 15% and the Free Democrats – 9%.
Chart 5: Ratings of Political Parties According to NDI’s 2016 Survey
As for the most recent survey, the question about the ratings of the parties received the following distribution of answers: Georgian Dream coalition – 16%, United National Movement – 15% and the Free Democrats – 9%.
Chart 5: Ratings of Political Parties According to NDI’s 2016 Survey
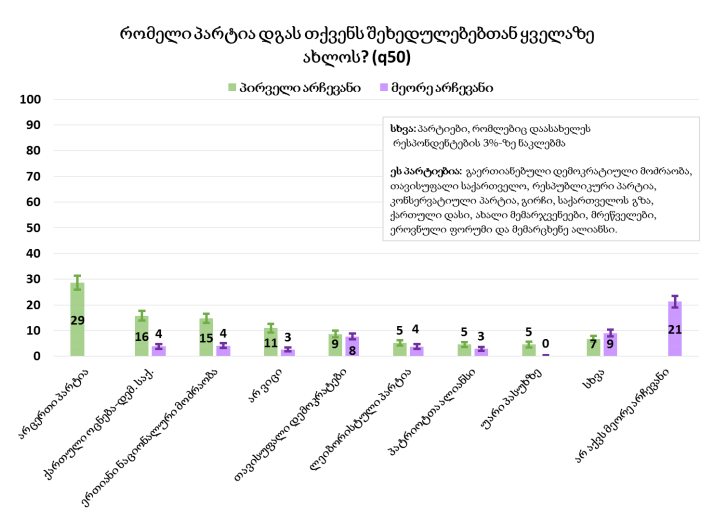 As we can see, according to the surveys of the National Democratic Institute, the percentage of the people seeing the Georgian Dream coalition as the party closest to them dropped by 47% thus far in 2016 as compared to 2012 whilst the percentage of those potentially supporting the United National Movement increased by 5%.
As for the Free Democrats, they separated themselves from the Georgian Dream coalition in the autumn of 2014. The ratings of the Free Democrats in the April 2015 survey equalled 5% whilst the percentage of their potential supporters increased to 9% in just one year. However, the Free Democrats had similar results according to the November 2015 survey as well with their ratings not having increased since then.
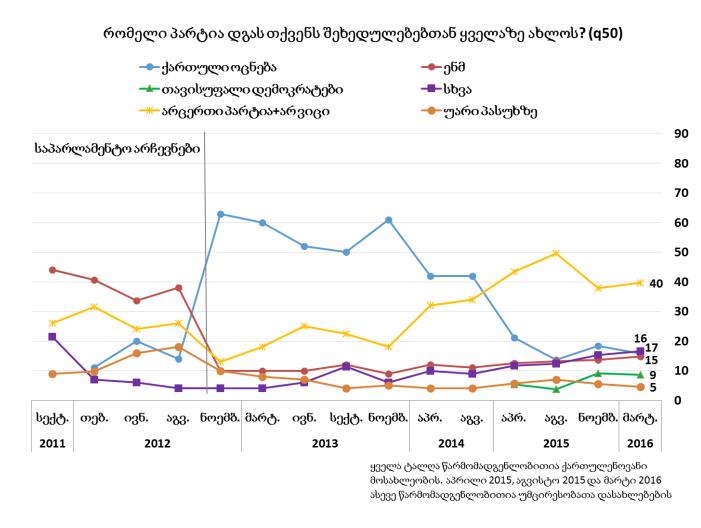
Chart 6: Changes in Potential Supporters of Political Parties from 2011 to 2016
As we can see, according to the surveys of the National Democratic Institute, the percentage of the people seeing the Georgian Dream coalition as the party closest to them dropped by 47% thus far in 2016 as compared to 2012 whilst the percentage of those potentially supporting the United National Movement increased by 5%.
As for the Free Democrats, they separated themselves from the Georgian Dream coalition in the autumn of 2014. The ratings of the Free Democrats in the April 2015 survey equalled 5% whilst the percentage of their potential supporters increased to 9% in just one year. However, the Free Democrats had similar results according to the November 2015 survey as well with their ratings not having increased since then.
Chart 6: Changes in Potential Supporters of Political Parties from 2011 to 2016
 Conclusion
Based upon the November 2015 and April 2016 surveys of the National Democratic Institute, the answers to the question If Parliamentary elections were held tomorrow, which party would you vote for? revealed that the ratings of the Georgian Dream coalition dropped by 1% over this time period (the same changes apply to the Free Democrats as well) whilst the ratings of the United National Movement increased by 3%.
At the same time, according to the answers to the second major question, Which party is closest to you?, the ratings of the Georgian Dream coalition decreased by 42% in April 2015 as compared to November 2012 whilst the April 2016 survey shows that these ratings have shrunk even further, by 5%, since November 2015 (the overall decrease from 63% to 16%). The ratings of the United National Movement, on the other hand, have increased by 5% since November 2012. As for the Free Democrats, the percentage of their potential supporters increased by 4% from April 2015 to April 2016.
Conclusion
Based upon the November 2015 and April 2016 surveys of the National Democratic Institute, the answers to the question If Parliamentary elections were held tomorrow, which party would you vote for? revealed that the ratings of the Georgian Dream coalition dropped by 1% over this time period (the same changes apply to the Free Democrats as well) whilst the ratings of the United National Movement increased by 3%.
At the same time, according to the answers to the second major question, Which party is closest to you?, the ratings of the Georgian Dream coalition decreased by 42% in April 2015 as compared to November 2012 whilst the April 2016 survey shows that these ratings have shrunk even further, by 5%, since November 2015 (the overall decrease from 63% to 16%). The ratings of the United National Movement, on the other hand, have increased by 5% since November 2012. As for the Free Democrats, the percentage of their potential supporters increased by 4% from April 2015 to April 2016.
As for the results of the previous survey published in November 2015, the same question got the following answer (see Chart 2): Georgian Dream coalition – 16%, United National Movement – 10% and the Free Democrats – 7%.
Chart 2: Ratings of Political Parties According to NDI’s November 2015 Survey
As we can see, the ratings of the Georgian Dream coalition and the Free Democrats saw little changes in spring 2016 as compared to November 2015 (the difference is only about 1%) whilst support grew by 3% in the case of the United National Movement.
FactCheck also took interest in the ratings of the political parties several months after the 2012 Parliamentary elections. In November 2012 the National Democratic Institute conducted a survey in which one of the main questions was Which party is closest to you? with the answers looking like this: Georgian Dream coalition – 63% and the United National Movement – 10% (see Chart 3).
Chart 3: Ratings of Political Parties According to NDI’s November 2012 Survey
The answers to the question, Which party is closest to you?, in the April 2015 survey looked like this: Georgian Dream coalition – 21%, United National Movement – 13% and the Free Democrats – 5%.
Chart 4: Ratings of Political Parties According to NDI’s April 2015 Survey
As for the most recent survey, the question about the ratings of the parties received the following distribution of answers: Georgian Dream coalition – 16%, United National Movement – 15% and the Free Democrats – 9%.
Chart 5: Ratings of Political Parties According to NDI’s 2016 Survey
As we can see, according to the surveys of the National Democratic Institute, the percentage of the people seeing the Georgian Dream coalition as the party closest to them dropped by 47% thus far in 2016 as compared to 2012 whilst the percentage of those potentially supporting the United National Movement increased by 5%.
As for the Free Democrats, they separated themselves from the Georgian Dream coalition in the autumn of 2014. The ratings of the Free Democrats in the April 2015 survey equalled 5% whilst the percentage of their potential supporters increased to 9% in just one year. However, the Free Democrats had similar results according to the November 2015 survey as well with their ratings not having increased since then.
Chart 6: Changes in Potential Supporters of Political Parties from 2011 to 2016
Conclusion
Based upon the November 2015 and April 2016 surveys of the National Democratic Institute, the answers to the question If Parliamentary elections were held tomorrow, which party would you vote for? revealed that the ratings of the Georgian Dream coalition dropped by 1% over this time period (the same changes apply to the Free Democrats as well) whilst the ratings of the United National Movement increased by 3%.
At the same time, according to the answers to the second major question, Which party is closest to you?, the ratings of the Georgian Dream coalition decreased by 42% in April 2015 as compared to November 2012 whilst the April 2016 survey shows that these ratings have shrunk even further, by 5%, since November 2015 (the overall decrease from 63% to 16%). The ratings of the United National Movement, on the other hand, have increased by 5% since November 2012. As for the Free Democrats, the percentage of their potential supporters increased by 4% from April 2015 to April 2016.
Tags: