

Presenting the draft state budget at the plenary session of the Parliament of Georgia on 13 November 2013, Minister of Finance, Nodar Khaduri, stated: “The imitation of economic growth, which was being contrived throughout the past years, was not felt by the people as poverty and unemployment saw no decrease in the country.”
FactCheck inquired about the accuracy of the statement.
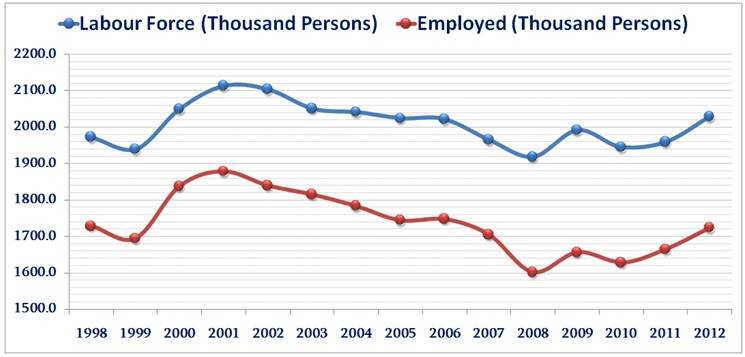
In line with the data provided by the National Statistics Office of Georgia, the rate of unemployment equalled 15% in 2012 while the rate of employment stood at 56.8%. In 2003 the unemployment rate was equal to 11.5% and the rate of employment was 58.6%. Subsequently, based upon the data of GeoStat, employment/unemployment indices worsened in 2012 relative to 2003.
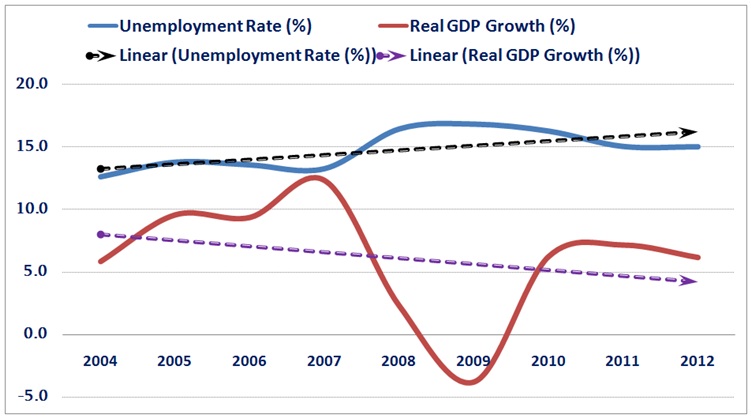
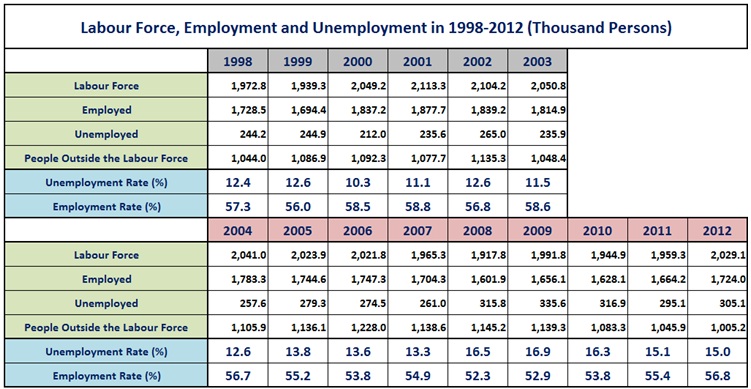 It can also be gathered from the table that unemployment rates saw an increase in 2004-2005 which was primarily caused by personnel cuts in the government sector and the restructuring of the economy. In the following years, the rates of unemployment varied according to the changes in the economic growth rates. In 2006-2007 unemployment rates demonstrated a tendency of a decrease; in 2008-2009 the indices saw an upturn while in 2010-2012 rates started declining again.
The graphs shown below present the dynamics of the Georgian labour force, employment and unemployment in the years 1998-2012.
It can also be gathered from the table that unemployment rates saw an increase in 2004-2005 which was primarily caused by personnel cuts in the government sector and the restructuring of the economy. In the following years, the rates of unemployment varied according to the changes in the economic growth rates. In 2006-2007 unemployment rates demonstrated a tendency of a decrease; in 2008-2009 the indices saw an upturn while in 2010-2012 rates started declining again.
The graphs shown below present the dynamics of the Georgian labour force, employment and unemployment in the years 1998-2012.
 As concerns poverty, according to the Social Service Agency and GeoStat, the share of population under the poverty threshold equalled 9.7% in 2012. Measurements of the headcount index of poverty (the share of the population under the poverty threshold) became available solely starting from 2007. Therefore, we have no means of comparing these figures with the indicators of 2003.
As can be seen in the chart depicted below, in 2009 the share of the population under the poverty threshold amounted to 6.4%. Owing to the Russian-Georgian war and the economic downturn resulting from it, the indicator came close to 9.9% in 2009. In the period between 2009 and 2012 the indices did not see any significant improvement; the figure for 2012 is slightly lower than that of 2009 while compared to the indicator of 2007 it shows an increase of 3.3%.
As concerns poverty, according to the Social Service Agency and GeoStat, the share of population under the poverty threshold equalled 9.7% in 2012. Measurements of the headcount index of poverty (the share of the population under the poverty threshold) became available solely starting from 2007. Therefore, we have no means of comparing these figures with the indicators of 2003.
As can be seen in the chart depicted below, in 2009 the share of the population under the poverty threshold amounted to 6.4%. Owing to the Russian-Georgian war and the economic downturn resulting from it, the indicator came close to 9.9% in 2009. In the period between 2009 and 2012 the indices did not see any significant improvement; the figure for 2012 is slightly lower than that of 2009 while compared to the indicator of 2007 it shows an increase of 3.3%.
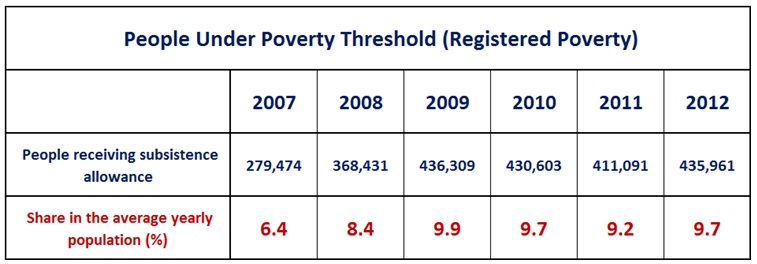 Considering that we hold statistical data on poverty rates only starting from 2007 and, therefore, cannot compare the indices of 2003 and 2012, it proves fairly difficult to estimate whether or not poverty has grown or decreased in the given period. Furthermore, the given indices are calculated by the Social Service Agency and reflect the number of people receiving social assistance and not immediately the number of people under the poverty threshold.
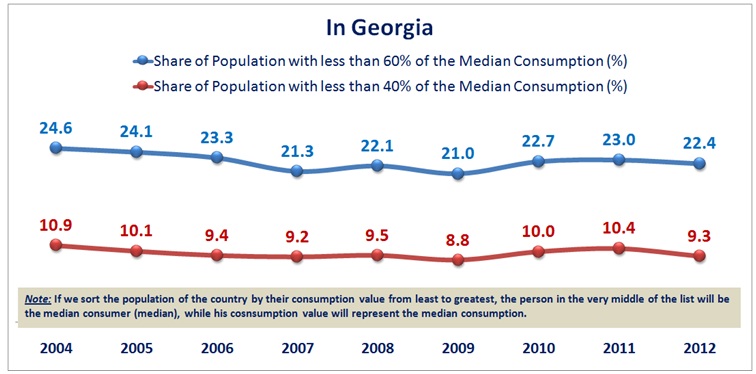
As for the relative poverty, it is to be noted that both indicators of relative poverty calculated by GeoStat are lower in 2013 than in 2004. Hence, the relative poverty indicator saw a minor, but still certain, improvement in the given period.
Considering that we hold statistical data on poverty rates only starting from 2007 and, therefore, cannot compare the indices of 2003 and 2012, it proves fairly difficult to estimate whether or not poverty has grown or decreased in the given period. Furthermore, the given indices are calculated by the Social Service Agency and reflect the number of people receiving social assistance and not immediately the number of people under the poverty threshold.
As for the relative poverty, it is to be noted that both indicators of relative poverty calculated by GeoStat are lower in 2013 than in 2004. Hence, the relative poverty indicator saw a minor, but still certain, improvement in the given period.
 It is also worthwhile noting that the change in the number of people employed in the economy and the indicator of poverty do not provide sufficient data for making judgements about the reality of economic growth and drawing a definite conclusion on the matter. Aside from the economic growth, improvement in the indices of registered poverty also depends upon the policy of income distribution.
The economic growth might not spur an increase in the rates of employment if a restructuring of the economy is underway (a shrinking of state bureaucracy, for instance) or technological progress raises the productivity of the employed.
In the period 2004-2012 nominal GDP saw a threefold growth, the real GDP – 1.7-fold, GDP per capita – threefold, state budget – 7.5-fold, pension – 8.5-fold, average nominal wage – 4.5-fold, export – 5.1-fold and so forth. Naturally, such results could not have been attained solely based upon the shadow economy and the reduction of corruption in the country and the size of the economy prior to 2004 presented no means of achieving such successes either. Consequently, the above-listed indices have been reached only due to real economic growth and the Minister’s assertions suggesting that the economic growth of 2003-2012 had been artificial and fabricated is certainly far from the reality.
Conclusion
It is safe to say that the indicators of poverty and unemployment have seen no improvement as compared to 2004. In 2012 the rates of unemployment were 2.4 times higher relative to the indicators of 2004 and the indices of the registered poverty have shown no tendency of a decrease throughout the last four years.
It should also be emphasised that the relative poverty mostly reflects how national income is distributed in the population and not how many people live in poverty. The poverty indicator is the headcount index of poverty. Data on the headcount index is available only starting from 2007 and the observed rise in it occurred due to the economic crisis of 2008-1009.
As for the GDP, the Minister’s allegations claiming the economic growth rate to be simply an imitation are undoubtedly false. It is a solid fact that the nominal GDP of Georgia saw a threefold increase, the real GDP grew 1.7-fold, nominal income per capita – 3.8-fold, the state budget – 7.5-fold and so forth. It is also evident that these indicators have been achieved based upon the real growth of the economy. Therefore, it is economically unjustifiable to diminish the significance of these indicators and speak about the imitation of the economic growth.
Consequently, we conclude that Nodar Khaduri’s statement, “The imitation of economic growth, which was being contrived throughout the past years, was not felt by the people as poverty and unemployment saw no decrease in the country,” is HALF TRUE.
It is also worthwhile noting that the change in the number of people employed in the economy and the indicator of poverty do not provide sufficient data for making judgements about the reality of economic growth and drawing a definite conclusion on the matter. Aside from the economic growth, improvement in the indices of registered poverty also depends upon the policy of income distribution.
The economic growth might not spur an increase in the rates of employment if a restructuring of the economy is underway (a shrinking of state bureaucracy, for instance) or technological progress raises the productivity of the employed.
In the period 2004-2012 nominal GDP saw a threefold growth, the real GDP – 1.7-fold, GDP per capita – threefold, state budget – 7.5-fold, pension – 8.5-fold, average nominal wage – 4.5-fold, export – 5.1-fold and so forth. Naturally, such results could not have been attained solely based upon the shadow economy and the reduction of corruption in the country and the size of the economy prior to 2004 presented no means of achieving such successes either. Consequently, the above-listed indices have been reached only due to real economic growth and the Minister’s assertions suggesting that the economic growth of 2003-2012 had been artificial and fabricated is certainly far from the reality.
Conclusion
It is safe to say that the indicators of poverty and unemployment have seen no improvement as compared to 2004. In 2012 the rates of unemployment were 2.4 times higher relative to the indicators of 2004 and the indices of the registered poverty have shown no tendency of a decrease throughout the last four years.
It should also be emphasised that the relative poverty mostly reflects how national income is distributed in the population and not how many people live in poverty. The poverty indicator is the headcount index of poverty. Data on the headcount index is available only starting from 2007 and the observed rise in it occurred due to the economic crisis of 2008-1009.
As for the GDP, the Minister’s allegations claiming the economic growth rate to be simply an imitation are undoubtedly false. It is a solid fact that the nominal GDP of Georgia saw a threefold increase, the real GDP grew 1.7-fold, nominal income per capita – 3.8-fold, the state budget – 7.5-fold and so forth. It is also evident that these indicators have been achieved based upon the real growth of the economy. Therefore, it is economically unjustifiable to diminish the significance of these indicators and speak about the imitation of the economic growth.
Consequently, we conclude that Nodar Khaduri’s statement, “The imitation of economic growth, which was being contrived throughout the past years, was not felt by the people as poverty and unemployment saw no decrease in the country,” is HALF TRUE.
It can also be gathered from the table that unemployment rates saw an increase in 2004-2005 which was primarily caused by personnel cuts in the government sector and the restructuring of the economy. In the following years, the rates of unemployment varied according to the changes in the economic growth rates. In 2006-2007 unemployment rates demonstrated a tendency of a decrease; in 2008-2009 the indices saw an upturn while in 2010-2012 rates started declining again.
The graphs shown below present the dynamics of the Georgian labour force, employment and unemployment in the years 1998-2012.
As concerns poverty, according to the Social Service Agency and GeoStat, the share of population under the poverty threshold equalled 9.7% in 2012. Measurements of the headcount index of poverty (the share of the population under the poverty threshold) became available solely starting from 2007. Therefore, we have no means of comparing these figures with the indicators of 2003.
As can be seen in the chart depicted below, in 2009 the share of the population under the poverty threshold amounted to 6.4%. Owing to the Russian-Georgian war and the economic downturn resulting from it, the indicator came close to 9.9% in 2009. In the period between 2009 and 2012 the indices did not see any significant improvement; the figure for 2012 is slightly lower than that of 2009 while compared to the indicator of 2007 it shows an increase of 3.3%.
Considering that we hold statistical data on poverty rates only starting from 2007 and, therefore, cannot compare the indices of 2003 and 2012, it proves fairly difficult to estimate whether or not poverty has grown or decreased in the given period. Furthermore, the given indices are calculated by the Social Service Agency and reflect the number of people receiving social assistance and not immediately the number of people under the poverty threshold.
As for the relative poverty, it is to be noted that both indicators of relative poverty calculated by GeoStat are lower in 2013 than in 2004. Hence, the relative poverty indicator saw a minor, but still certain, improvement in the given period.
It is also worthwhile noting that the change in the number of people employed in the economy and the indicator of poverty do not provide sufficient data for making judgements about the reality of economic growth and drawing a definite conclusion on the matter. Aside from the economic growth, improvement in the indices of registered poverty also depends upon the policy of income distribution.
The economic growth might not spur an increase in the rates of employment if a restructuring of the economy is underway (a shrinking of state bureaucracy, for instance) or technological progress raises the productivity of the employed.
In the period 2004-2012 nominal GDP saw a threefold growth, the real GDP – 1.7-fold, GDP per capita – threefold, state budget – 7.5-fold, pension – 8.5-fold, average nominal wage – 4.5-fold, export – 5.1-fold and so forth. Naturally, such results could not have been attained solely based upon the shadow economy and the reduction of corruption in the country and the size of the economy prior to 2004 presented no means of achieving such successes either. Consequently, the above-listed indices have been reached only due to real economic growth and the Minister’s assertions suggesting that the economic growth of 2003-2012 had been artificial and fabricated is certainly far from the reality.
Conclusion
It is safe to say that the indicators of poverty and unemployment have seen no improvement as compared to 2004. In 2012 the rates of unemployment were 2.4 times higher relative to the indicators of 2004 and the indices of the registered poverty have shown no tendency of a decrease throughout the last four years.
It should also be emphasised that the relative poverty mostly reflects how national income is distributed in the population and not how many people live in poverty. The poverty indicator is the headcount index of poverty. Data on the headcount index is available only starting from 2007 and the observed rise in it occurred due to the economic crisis of 2008-1009.
As for the GDP, the Minister’s allegations claiming the economic growth rate to be simply an imitation are undoubtedly false. It is a solid fact that the nominal GDP of Georgia saw a threefold increase, the real GDP grew 1.7-fold, nominal income per capita – 3.8-fold, the state budget – 7.5-fold and so forth. It is also evident that these indicators have been achieved based upon the real growth of the economy. Therefore, it is economically unjustifiable to diminish the significance of these indicators and speak about the imitation of the economic growth.
Consequently, we conclude that Nodar Khaduri’s statement, “The imitation of economic growth, which was being contrived throughout the past years, was not felt by the people as poverty and unemployment saw no decrease in the country,” is HALF TRUE.