

Resume:
Price levels in Georgia have been stable in the last years. As of October 2018, the annual inflation rate stands at 2.3% which is 0.7 of a percentage point less as compared to the targeted inflation. Therefore, there is no solid ground to underline problems caused by an increased general level of consumer prices.
However, the price hike on certain groups of consumer goods has been higher as compared to others. For example, there are increased prices on pharmaceuticals and fuel – prices on goods related to healthcare and the cost of transportation have increased by 6.1% and 6.5%, respectively, as compared to October 2017. The price hike on pharmaceuticals[1] per se is 12% and on the use of vehicles[2]is 10%. At the same time, the prices on food and non-alcoholic beverages have not increased with an annual growth rate of only 0.2%. Moreover, if food prices are taken separately, the growth in their numbers is zero.
In regard to Otar Kakhidze’s emphasis on the low economic growth rate, Georgia’s annual average economic growth rate constituted 3.7% in the last five years which is indeed an unsatisfactory performance for a developing country like Georgia. Therefore, the real gross domestic product (GDP) per capita, as an indirect indicator of income, is increasing albeit at a slow rate.
Analysis European Georgia – Movement for Freedom MP, Oto Kakhidze, stated
that prices on every essential consumption item, including fuel, medication and foodstuffs, have increased whilst the economic growth rate is very low.
The consumer price index (CPI) is used to measure changes in prices (inflation). The CPI is measured by changes in the prices on goods and services comprising the consumer basket. Prices are monitored in six cities in Georgia and the results are generalised for the entire country. The consumer basket includes 305 widely consumed goods and services which are dividedinto 12 groups. It is possible that prices on separate goods could increase faster as compared to the general level of prices whilst prices on other groups could increase more slowly or even show a decrease. For instance, an inflation level of 2.3% does not mean that the prices on every group in the consumer basket have increased by 2.3%. In fact, it is possible that prices on healthcare, for example, increase by 6.1% whilst prices on garments decrease by 7.1% and so on.
Usually, in the absence of an economic crisis/recession, the price level tends to increase and the inflation rate is higher than 0. An inflation rate which is neither very high nor very low is good for the economy. Therefore, a certain increase in price levels is desirable for the economy. The National Bank of Georgia determines the targeted level of inflation. The figure is 3% for 2018. As of October, the country’s actual annual inflation[3] constitutes 2.3% and is 0.7 of a percentage point less as compared to the targeted level. Therefore, it is groundless to emphasise a general increase in price levels. In the last years, the increase in price levels has not been as high as to be considered as negatively affecting the economic situation. The inflation rate was relatively higher in 2017 which was stipulated by the Government of Georgia’s decision to increase the excise tax rate and which hada one-off effect.
Graph 1:
Consumer Price Level – Annual Inflation
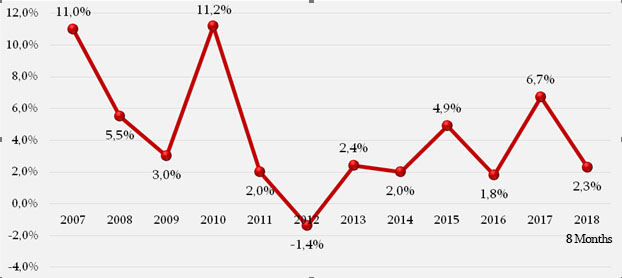 Source: National Statistics Office of Georgia
At the same time, there might be certain groups where changes in price levels substantially deviate from the general trend even if the general price level is stable. In regard to changes in the price levels on certain groups of goods, the table below illustrates that prices have increased on alcoholic beverages, tobacco, healthcare and transport in October 2018 as compared to other goods and as compared to the same period of the previous year. Meanwhile, prices decreased on garments and footwear as well as on communication in the same period.
Table 1:
Changes in Prices on Groups of Goods
| Groups of Goods | Annual Inflation | Share to Annual Inflation |
| Food and non-alcoholic beverages | 0.2% | 0.1% |
| Alcoholic beverages, tobacco | 5.7% | 0.4% |
| Garments and footwear | -7.1% | -0.3% |
| Accommodation, water, energy, gas | 4.4% | 0.4% |
| Furniture, household items, house cleaning | 0.9% | 0.1% |
| Healthcare | 6.1% | 0.5% |
| Transport | 6.5% | 0.9% |
| Communication | -1.4% | -0.1% |
| Vacation, leisure and culture | 1.2% | 0.1% |
| Education | 2.4% | 0.1% |
| Hotels, cafes and restaurants | 2.5% | 0.1% |
| Different goods and services | 0.6% | 0.0% |
| Annual Inflation | 2.3% | |
Of the aforementioned goods, of note is the increase in prices on pharmaceuticals and fuel – the prices on goods relating to healthcare and transportation increased by 6.1% and 6.5%, respectively, as compared to October 2017. The price hike on pharmaceuticals per se is 12% and on the use of vehicles is 10%. At the same time, prices on food and non-alcoholic beverages have not increased and their annual growth is 0.2% whilst the growth of prices for food taken separately is zero.
Graph 2:
Economic Growth Rate and GDP Per Capita
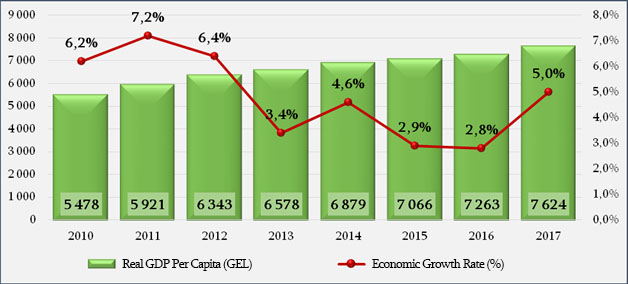 Source: National Statistics Office of Georgia
Developing countries usually have a much higher economic growth rate than developed nations. In the last five years, Georgia’s annual average economic growth rate was 3.7% which is a very low figure for a developing country like Georgia. Therefore, the real GDP per capita,[4]
Source: National Statistics Office of Georgia
Developing countries usually have a much higher economic growth rate than developed nations. In the last five years, Georgia’s annual average economic growth rate was 3.7% which is a very low figure for a developing country like Georgia. Therefore, the real GDP per capita,[4] as an indirect indicator of income, is increasing albeit at a slow rate.
[1]
Component of healthcare goods which includes medications.
[2]Component of transport which includes fuel.
[3]As compared to the respective month of the previous year.
[4] Impact of change in price level excluded.