

Verdict:FactCheck concludes that Giorgi Kobulia’s statement is TRUE.
Resume: The country’s current account deficit means that foreign currency outflows exceed foreign currency inflows which negatively affects the economy. It puts pressure on the national currency exchange rate and necessitates paying for the deficit from the financial account (investments, taking debt, cutting reserves). A high current account deficit increases the risks for issuing loans for the economy which results in a lack of accessibility to loan resources and/or increased interest rates.
Traditionally, the major reason behind the current account deficit in Georgia has been the negative balance of trade in goods (when the value of imports exceeds the value of exports) which is partially compensated by trade in services, mostly at the expense of tourism revenues. In 2017, the deficit in the trade in goods constituted USD 3.8 billion whilst net tourism revenues reached USD 2.2 billion.
Therefore, the context of Giorgi Kobulia’s statement in regard to trends of changes in certain components of the balance of payments and their interconnectedness is right whilst the figures given differ only slightly from the actual numbers.
Analysis
The Minister of Economy and Sustainable Development of Georgia, Giorgi Kobulia, stated that Georgia has an annual USD 3.5 billion trade deficit which means that the value of the country’s imported goods is USD 3.5 billion more as compared to the value of the goods it exports. As clarified by the Minister, this difference (deficit) will be compensated by other sources with USD 2.5 billion of the aforementioned USD 3.5 billion covered by tourism revenues.
The country’s balance of payments provides complete data about foreign currency inflows and outflows. The balance of payments is a type of report which details the movement of money between the country’s economy and the rest of the world. The balance of payments consists of the current account, the capital account and the financial account.
The current account includes the component of trade in goods and services as well as the revenues and remittances component. In turn, the revenues component shows inflows of revenues from abroad (in particular, labour remuneration and investment income) and revenues transferred from Georgia. Remittances include money transfers between residents and non-residents of the country (for instance, grants and financial assistance).
The capital account includes capital transfers and the purchase/transfer of non-produced non-financial assets. One of the forms of capital transfers is debt forgiveness.
The financial account includes direct investments, portfolio investments, financial derivatives, other investments and reserve assets.
If a country has a current account deficit, meaning that foreign currency outflows exceed foreign currency inflows, this deficit is covered from its financial account (investment, taking debt and decreasing currency reserves).
The trends of changes in the current account deficit are given in Table 1. As of 2017, the current account deficit was reduced by USD 531 million as compared to the previous year (which indicates an improvement of the situation) and dropped to USD 1,316 million. In the same period, the deficit to GDP ratio amounted to 8.7% which is one of the lowest figures in the last years and only lags behind the figure for 2013 (5.9%). In accordance with the data of the first two quarters of 2018, the current account deficit increased by USD 139 million as compared to the same period of 2017 and amounts to USD 803 million. The current account deficit to GDP ratio is 10.29% which is 0.77 of a percentage point higher as compared to the same period of the previous year.
Table 1: Trends of Changes in Georgia’s Current Account Deficit
|
|
2013 |
2014 |
2015 |
2016 |
2017 |
2017 6 Months |
2018 6 Months |
|
GDP (GEL Million) |
26,847 |
29,150 |
31,756 |
34,028 |
38,042 |
17,447 |
19,241 |
|
GDP (USD Million) |
16,140 |
16,509 |
13,994 |
14,378 |
15,189 |
6,970 |
7,807 |
|
Current Account Deficit (USD Million) |
-958 |
-1,790 |
-1,696 |
-1,847 |
-1,316 |
-664 |
-803 |
|
Difference as Compared to Previous Period (USD Million) |
928 |
-832 |
94 |
-151 |
531 |
207 |
-139 |
|
Deficit to GDP Ratio |
5.90% |
10.80% |
12.10% |
12.80% |
8.70% |
9.52% |
10.29% |
Source:National Bank of Georgia
In regard to the trends of deficit accumulation, of note is that the main reason behind the negative trade balance is the trade in goods. In particular, the deficit of the trade in goods decreased marginally (0.74%) in 2017 as compared to the same figure of the previous period and amounted to USD 3.8 billion. This deficit is partially covered by the positive balance of the trade in services, mostly at the expense of tourism revenues (USD 2.24 billion).
Graph 1: Trade Deficit and Tourism Revenues
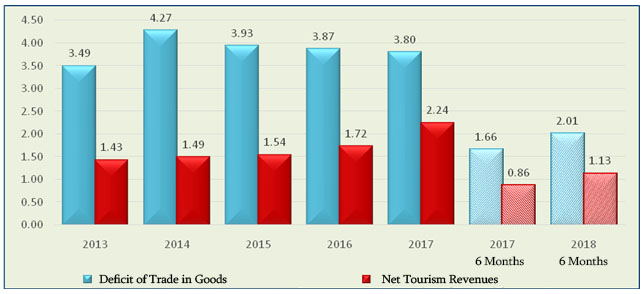
Source:National Bank of Georgia
As illustrated by the graph, the trend has been maintained as of the first two quarters of 2018. In accordance with the data for January-September 2018, the deficit of the trade of goods reached USD 2 billion. Of this amount, USD 1.13 billion was covered by net tourism revenues.