

On 30 May 2016, the former Prime Minister of Georgia and founder of the Georgian Dream party, Bidzina Ivanishvili, addressed the population with a letter which gives a comparison of the situation under the rule of the previous and incumbent governments. Mr Ivanishvili believes that the new Government of Georgia has improved the situation in absolutely every aspect listed in his letter.
FactCheck verified the accuracy of several of Bidzina Ivanishvili’s statements in the letter and published them on 7 June 2016 (see the link).Now, we offer the second part of the facts from Ivanishvili’s letter which we verified.
FactCheck has written
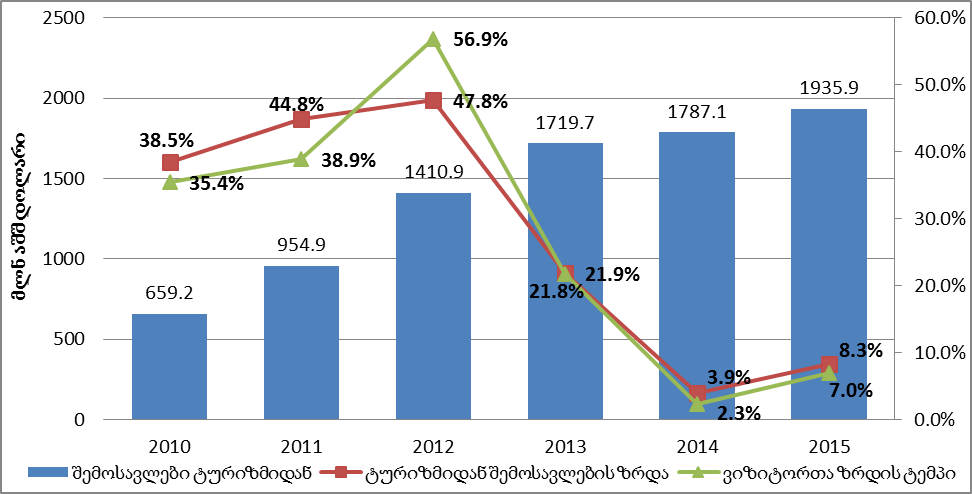
about this topic before. In 2010-2012, net revenues from international tourism were USD 2,356 million whilst this number reached USD 4,520 million in 2013-2015. The former Prime Minister names the numbers correctly, but the success or failure in terms of the number of tourists and the amount of tourism revenues are measured by their annual growth rates.
In 2010-2012, tourism revenues increased by 58%, whilst this number was 12% in 2013-2015. The same method is used by the World Tourism Organization. Therefore, this means that the pace of growth in tourism in 2013-2015 actually became slower as compared to 2010-2012 with this decrease particularly evident in 2014 owing to the flawed new visa policyof the Government of Georgia (the Government of Georgia later acknowledged their mistake). Bidzina Ivanishvili did not pay attention to this particular fact in his letter.
Graph 1:
Dynamics of Growth in Number of Visitors and Tourism Revenues in 2010-2015 (USD million)
In regard to 2016’s data, Bidzina Ivanishvili uses the correct methodology of comparison in this case (this in turn indicates that he uses the methodology of comparison selectively in order to portray the existing situation better than it really is). Even though the data about tourism revenues in January-April this year are not yet available, we might assume that the number as stated (17%) is correct. The number of international visitors who entered Georgia in January-April increased by 15.4% (the growth rate of the number of visitors and the rate of tourism revenues usually match each other). FactCheck
also took interest in the growth rate of tourism revenues in the January-April periods of 2010-2015. However, considering the fact that these data are not published upon a monthly basis (only quarterly data are available), we compared the numbers of the first quarters in the period of 2010-2016.
Graph 1:
Tourism Revenues in the First Quarters of 2010-2016
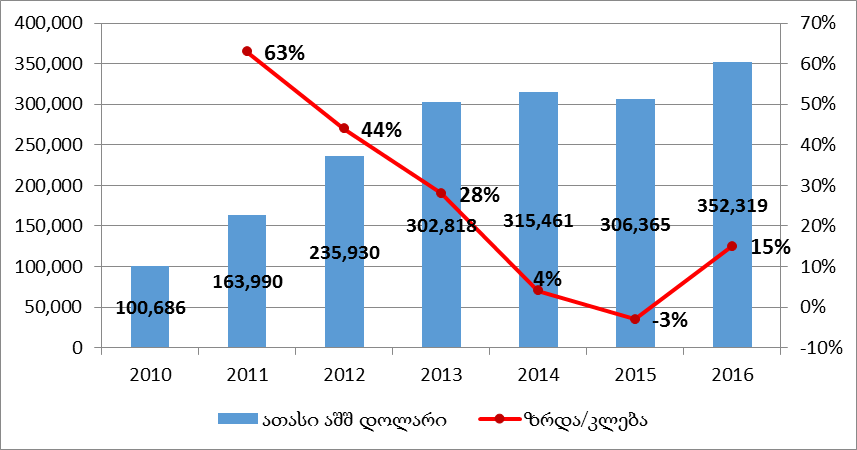
As illustrated by the graph, the growth rate of revenues from international tourism was the lowest in 2014-2015 based upon first quarter data. Both the growth rate and the amount of revenues dropped in January-March 2015.
Georgia’s total foreign debt includes the foreign debts of both the private sector and the state. In 2007-2009 Georgia’s foreign debt increased by USD 5.034 billion, by USD 4.453 billion in 2010-2012 but only by USD 1.686 billion in 2013-2015. The numbers given in Ivanishvili’s letter are accurate. However, it is questionable what these numbers really show and whether or not the Government of Georgia’s role is benign in these processes.
There is nothing wrong when the private sector manages to attract foreign funds. This contributes to the development of the country’s economy. More than half of Georgia’s foreign debt constitutes the debt of the private sector. In regard to the growth rate of state foreign debt, this was mostly caused by the impact of the Russia-Georgia war in 2008 and the world financial crisis in the period of 2008-2011. From 2003 until 2008, state foreign debt (the combined debt of the Government of Georgia and the National Bank) decreased by USD 26 million. The rapid growth of state foreign debt started in 2008 with the average annual growth of the foreign debt at USD 670 million until the end of 2012.
In regard to the active payment of Georgia’s debts from 2013, this was indeed true in the period of 2013-2014 but the debt once again increased in 2015. Of note is that the decrease in state debt in 2013-2014 was caused by the National Bank’s payment of its own debts. In total, the National Bank paid USD 363 million of its own debt in 2013-2015 whilst the Government of Georgia’s debt increased by USD 139 million.
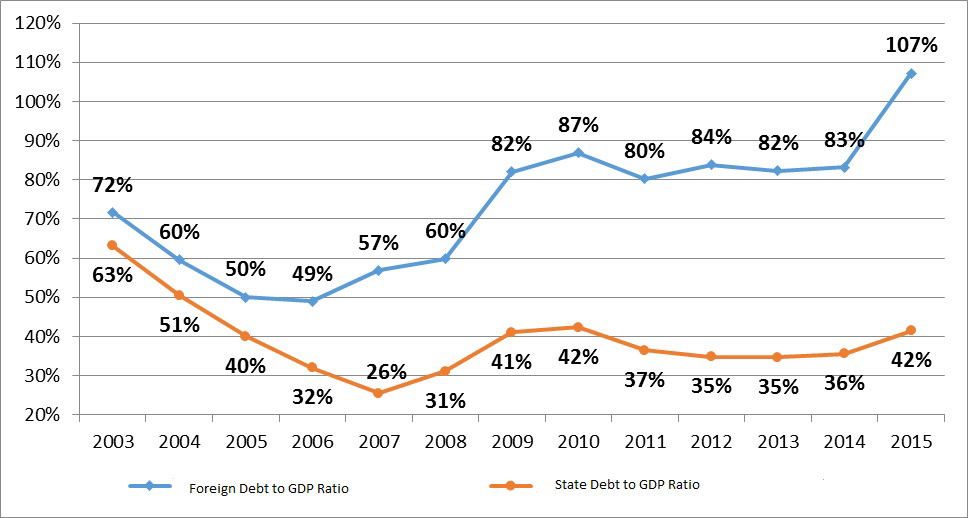
Generally, when speaking about a country’s debt burden, it is the debt to GDP ratio which is important and not the changes in the nominal indicators of the debt (changes in USD millions). In this regard, Georgia’s positions worsened in the last three years (see Graph 1). The worsening of the debt to the GDP ratio was mostly caused by the GEL depreciation and a slowing down of the economic growth rate.
The population is misled by the fact that Bidzina Ivanishvili’s letter emphasises foreign debt and not the total state debt. The volume of the total state debt is directly dependent upon the government’s performance and includes domestic debt as well as foreign debt. On 31 December 2012 the state domestic debt was GEL 1,895 million (7.2% to GDP) whilst it increased by almost GEL 1 billion by the end of 2015 and reached GEL 2,827 million (8.9% to GDP). The total state debt at the end of 2012 was 35% of the GDP whilst it once again increased to 42% at the end of 2015.
Graph 1:
State and Foreign Debt to GDP Ratio
The World Economic Forum publishes its Competitiveness Index ranking upon an annual basis. The ranking for each year is based upon the data of the previous year; for example, the ranking for 2015-2016 is based upon 2014’s data. Therefore, if we want to compare Georgia’s position under the previous government and its position under the incumbent government, we have to use the following competitiveness rankings: 2013-2014 and 2015-2016. The situation for 2015 will be reflected in the 2016-2017 ranking which will be published in autumn of this year.
Based upon the 2006-2007 report which reflects the situation in 2005, Georgia was in the 85th place (with 3.7 points). After 2005, even though Georgia’s points improved, the country moved down to the 93rd place. This was caused by rapid progress in other countries in the list. Since 2010, the increase in Georgia’s own points in the ranking has also impacted its position. As of 2012 (which is given in the 2013-2014 report), Georgia moved up to the 72nd place. In 2013-2014, Georgia’s ranking improved slightly (0.07) and the country moved up to the 66thplace.
As of 2012, Georgia was ahead of four European Union countries (with present-day membership) – Croatia, Romania, Slovakia and Greece. According to the last report, we are ahead of three EU member states – Slovakia, Croatia and Greece.
| 2003 | 2004 | 2005 | 2006 | 2007 | 2008 | 2009 | 2010 | 2011 | 2012 | 2013 | 2014 | |
| Place | 94 | 86 | 85 | 90 | 90 | 90 | 93 | 88 | 77 | 72 | 69 | 66 |
| Points | 3.1 | 3.3 | 3.7 | 3.8 | 3.9 | 3.8 | 3.9 | 4.0 | 4.1 | 4.15 | 4.22 | 4.22 |
Bidzina Ivanishvili has not named the specific data based upon which he made his statement. Perhaps, he was referring to construction permits based upon floor space. The numbers he named do match these particular statistics.
According to the National Statistics Office of Georgia, construction permits were issued for 15,081,023 square metres in 2010-2012 whilst this number was 23,472,552 square metres in 2013-2015. Therefore, this gives a 56% growth which matches the number named by Mr Ivanishvili. In the case of Tbilisi, growth constitutes 63%. In the case of Ajara, the growth is at 70%. Of note is the fact that 2010 and 2011 are post-crisis period years when many construction firms temporarily halted their work or went bankrupt.
Table 1:
Issued Construction Permits (Square Metres)
| 2010 | 2011 | 2012 | 2013 | 2014 | 2015 | |
| In total | 2,800,199 | 5,682,595 | 6,598,229 | 8,374,817 | 7,258,011 | 7,839,726 |
| Tbilisi | 1,010,785 | 3,933,260 | 4,494,893 | 5,957,076 | 4,626,021 | 4,842,318 |
| Ajara | 879,942 | 914,402 | 1,165,742 | 1,589,905 | 1,650,138 | 1,804,297 |
Similar to some other aforementioned cases, Bidzina Ivanishvili makes an incorrect comparison to illustrate the processes in the construction field. The fact that construction permits were issued for a larger area in 2013-2015 as compared to 2010-2012 is not the main indicator of the development in the field. More important is to see how the volume of construction permits (in square metres) increased upon a year to year basis. We managed to obtain this type of information starting from 2011. In 2011, the volume of construction permits doubled and increased by 16% in 2012. In 2013 the number increased by 27%, decreased by 13% in 2014 and increased again by 8% in 2015. In 2011-2012, the average growth was 60% whilst this number was 7% in 2013-2016. Of additional note is that the number registered in 2015 is 6% less than the same number registered in 2013.